Category

Html Infographic

Maximize the Potential of Your Infographic, Make it Go Viral!

By Animated Infographic, Html Infographic, Infographic, Interactive Infographic, Static Infographic, Video Based Infographic
Maximize the Potential of Your Infographic, Make it Go Viral!

An infographic is a lot more than just a JPEG which looks good and conveys the information in an appealing form. Apart from that, it can be used in many more ways than just a post on your website or a social sharing item. With so many types of infographics in the market today, it’s important to choose the right one for your business.

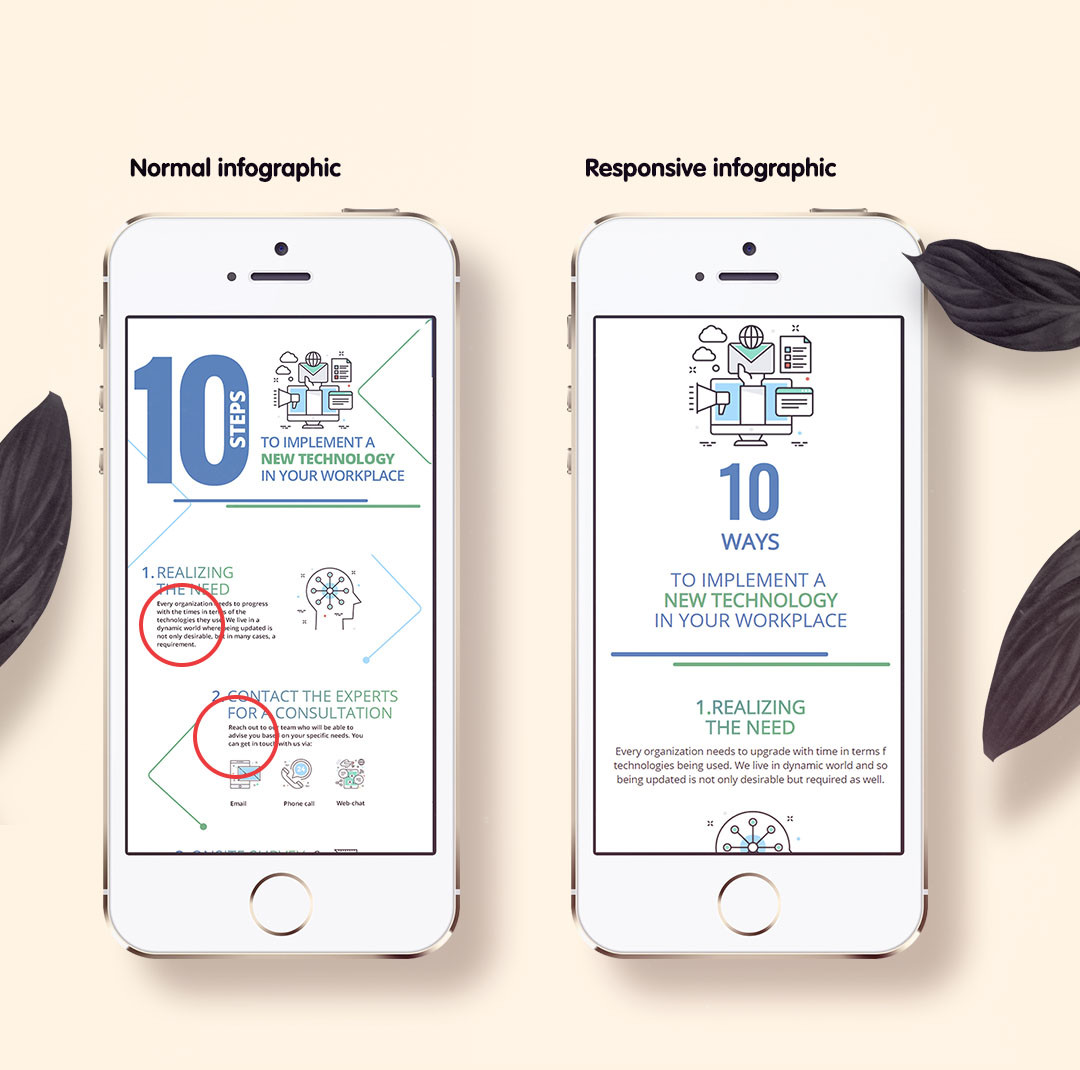
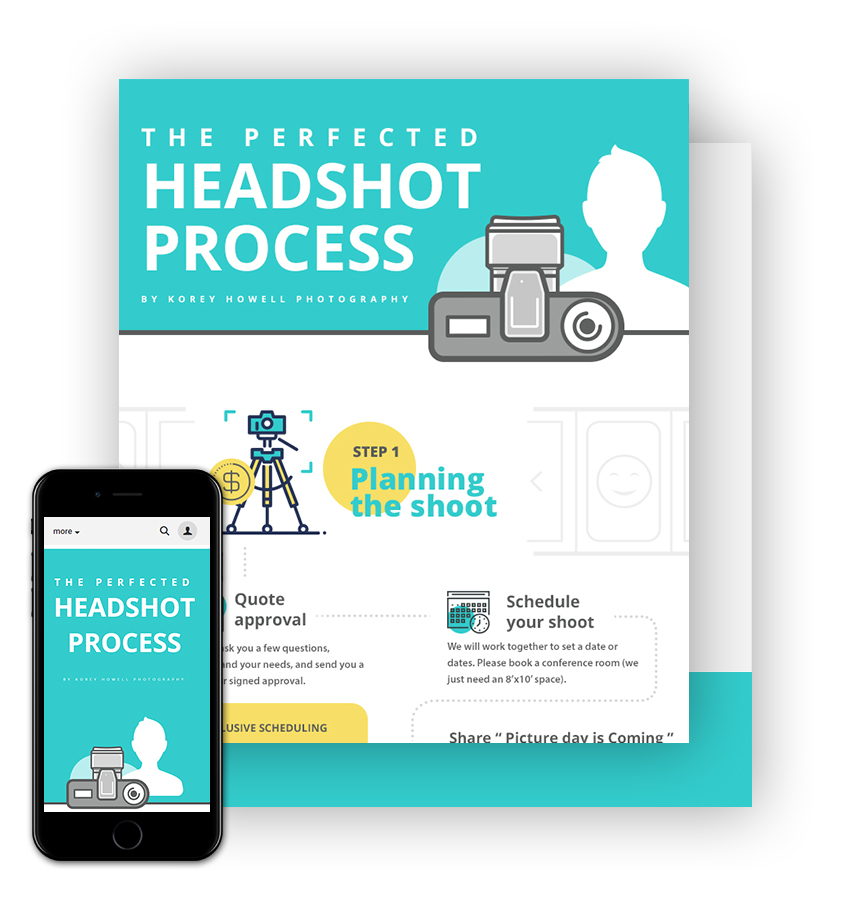
If you’ve ever seen an infographic on your phone you must know how uncomfortable and unimpactful it can be. You may have had to zoom everything, which would have killed the impact of the infographic in that very instant. In many cases, if you share a very long infographic on social media, it may hamper your feed more than helping it. The reason behind this is that most infographics are not mobile responsive, which makes the text on the infographic look extremely small. Same is the case when a long infographic post is shared on social media channels like Twitter. Honestly, I have seen many successful people doing this.

So is there a brighter side to it?

Absolutely. Infographic designs have evolved over time to provide solutions that are mobile mobile-friendly. In this article, however, we will focus on how you can use infographics more effectively to maximize outputs.

Here are various forms an infographic can elevate to. 

Level 1: The basic JPEG

Level 2: Animate it and make it impactful

Level 3: Make it responsive with HTML

Level 4: Add Animation To HTML Infographics

Level 5: Make it socially shareable

Level 6: Make it viral

Level 7: Make a video infographics

Level 8: Extreme: Make a landing page using infographics to 10x your marketing efforts

Level 1: The Basic Form

Keep JPEG as your chosen format style with an average dimension of 700 pixels by 2000 pixels. Creating a good JPEG infographic is key because you can easily place it anywhere on your website and it can serve as basics for taking your infographic to the next level. The infographic is also great for sharing on websites like Pinterest and for uploading on infographic directories.

Level 2: Make Them Impactful

Gifographic

If you want to make an impact, you must stand out. Adding animation to your infographic allows you to capture the attention of your user, even if it’s for one second. While the same infographic can be shared as an image, making it animated catches the attention even more than a static infographic. 

This is a fine and effective way of repackaging an infographic if you do not have the time or the budget for a video but want to avoid making a static infographic. Remember that GIF infographics, also known as gifo-graphics and animated infographics are a bit small as compared to static infographics. This is owing to the limitations of the GIF creation process.

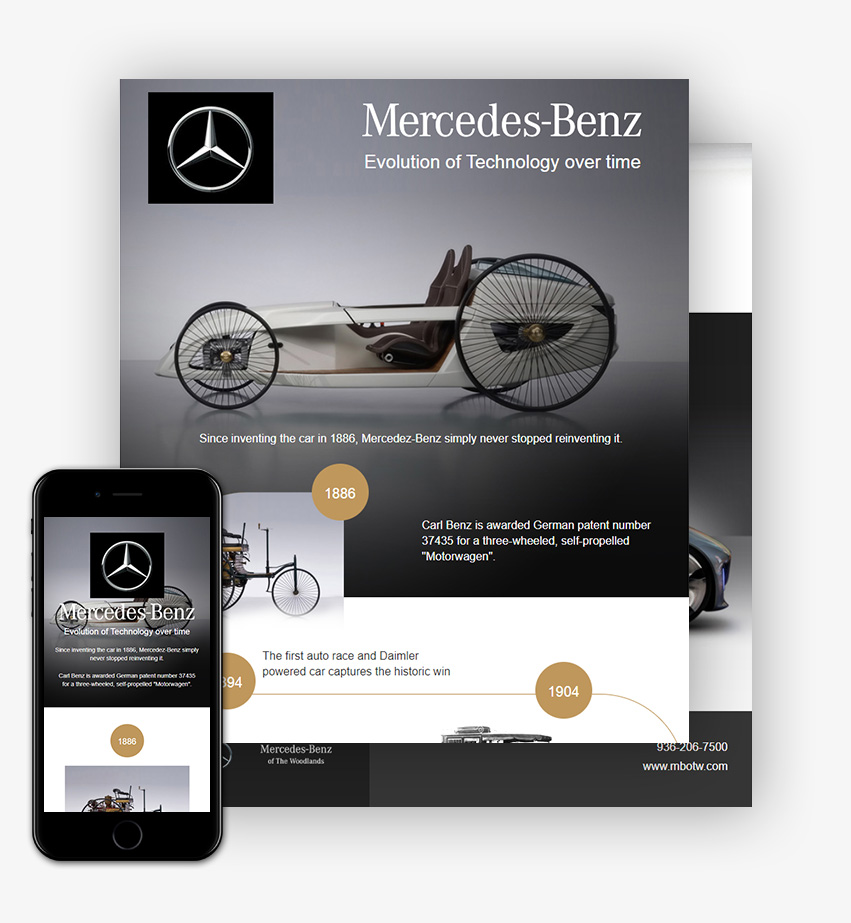
Level 3: Make Them Responsive

The good news is, you don’t have to restrict your infographics to JPEG images and animated GIFs, instead you get them created in HTML. What this does is, it makes your infographic mobile-responsive. So, your infographic looks the same on desktop and it looks great on your phone as well. 

Remember, you will still need static infographics along with HTML ones for posting them on directory listings. So, ensure that you hire an infographics designer who can convert a static infographic into an HTML one without any visible difference.

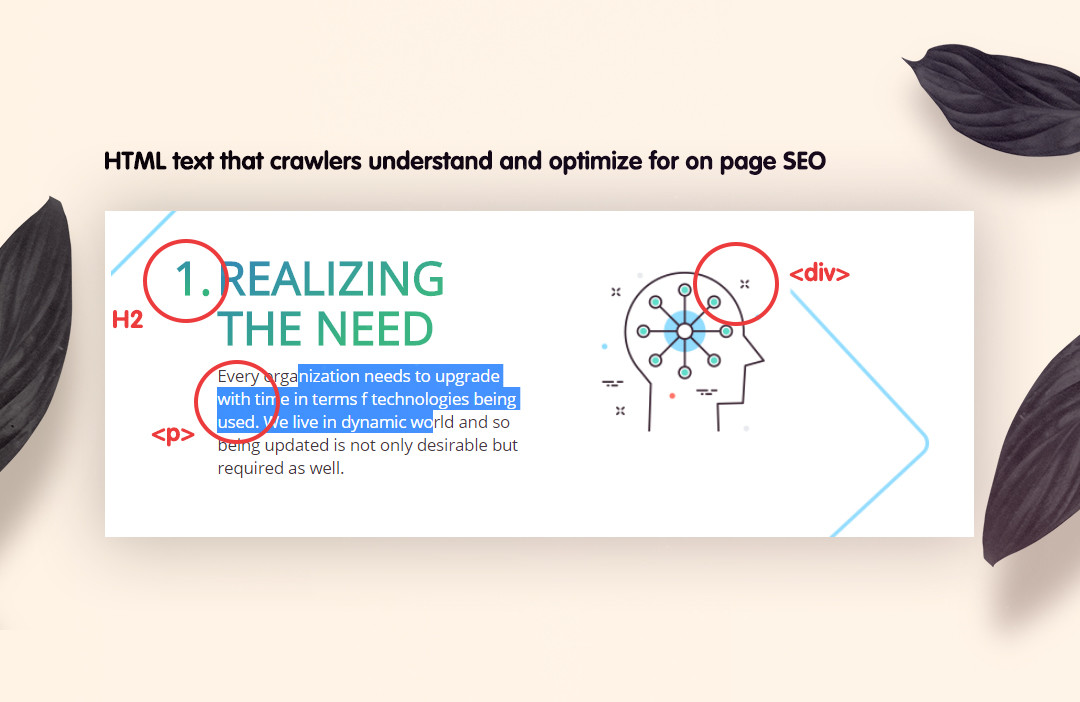
Once you get an infographic created in both formats, you can use the static one for posting on infographic directories and the HTML version for your website. Another benefit of having an HTML infographic or web-based infographic is that it is SEO-friendly. This means that Google crawlers

can crawl through the text written on your infographic and help with your SEO-efforts. Read more about it here.

Level 4: Add Animation To HTML Infographics

There is a bit of difference in Level 2 & Level 4. After creating a gifographic or an animated infographic, you can easily convert it into an HTML version. What this does is that it removes the ‘size’ limit from the animated infographics, so you can create one big infographic made up of many small ones. To be clear, there is no restriction on size when creating HTML infographics.

Level 5: Go Social The Right Way

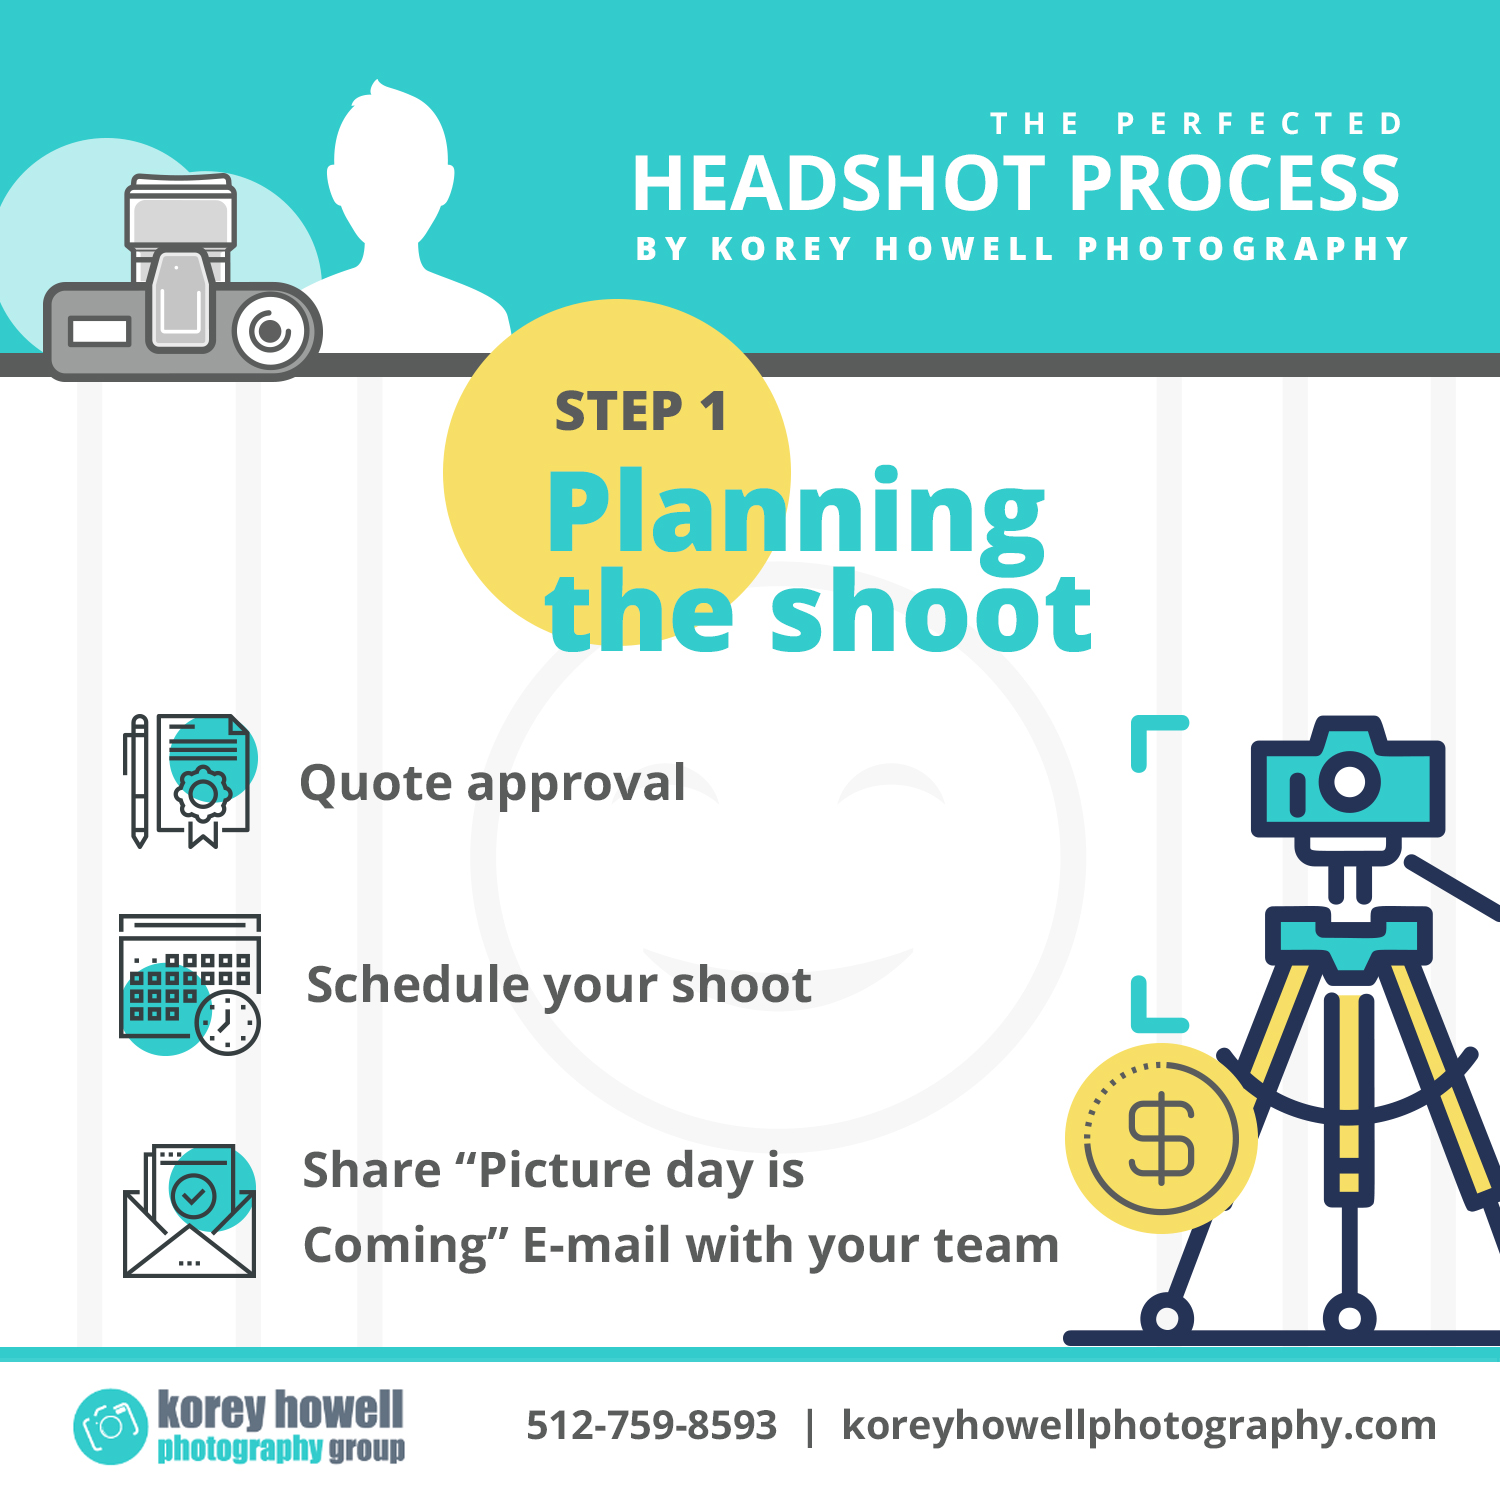
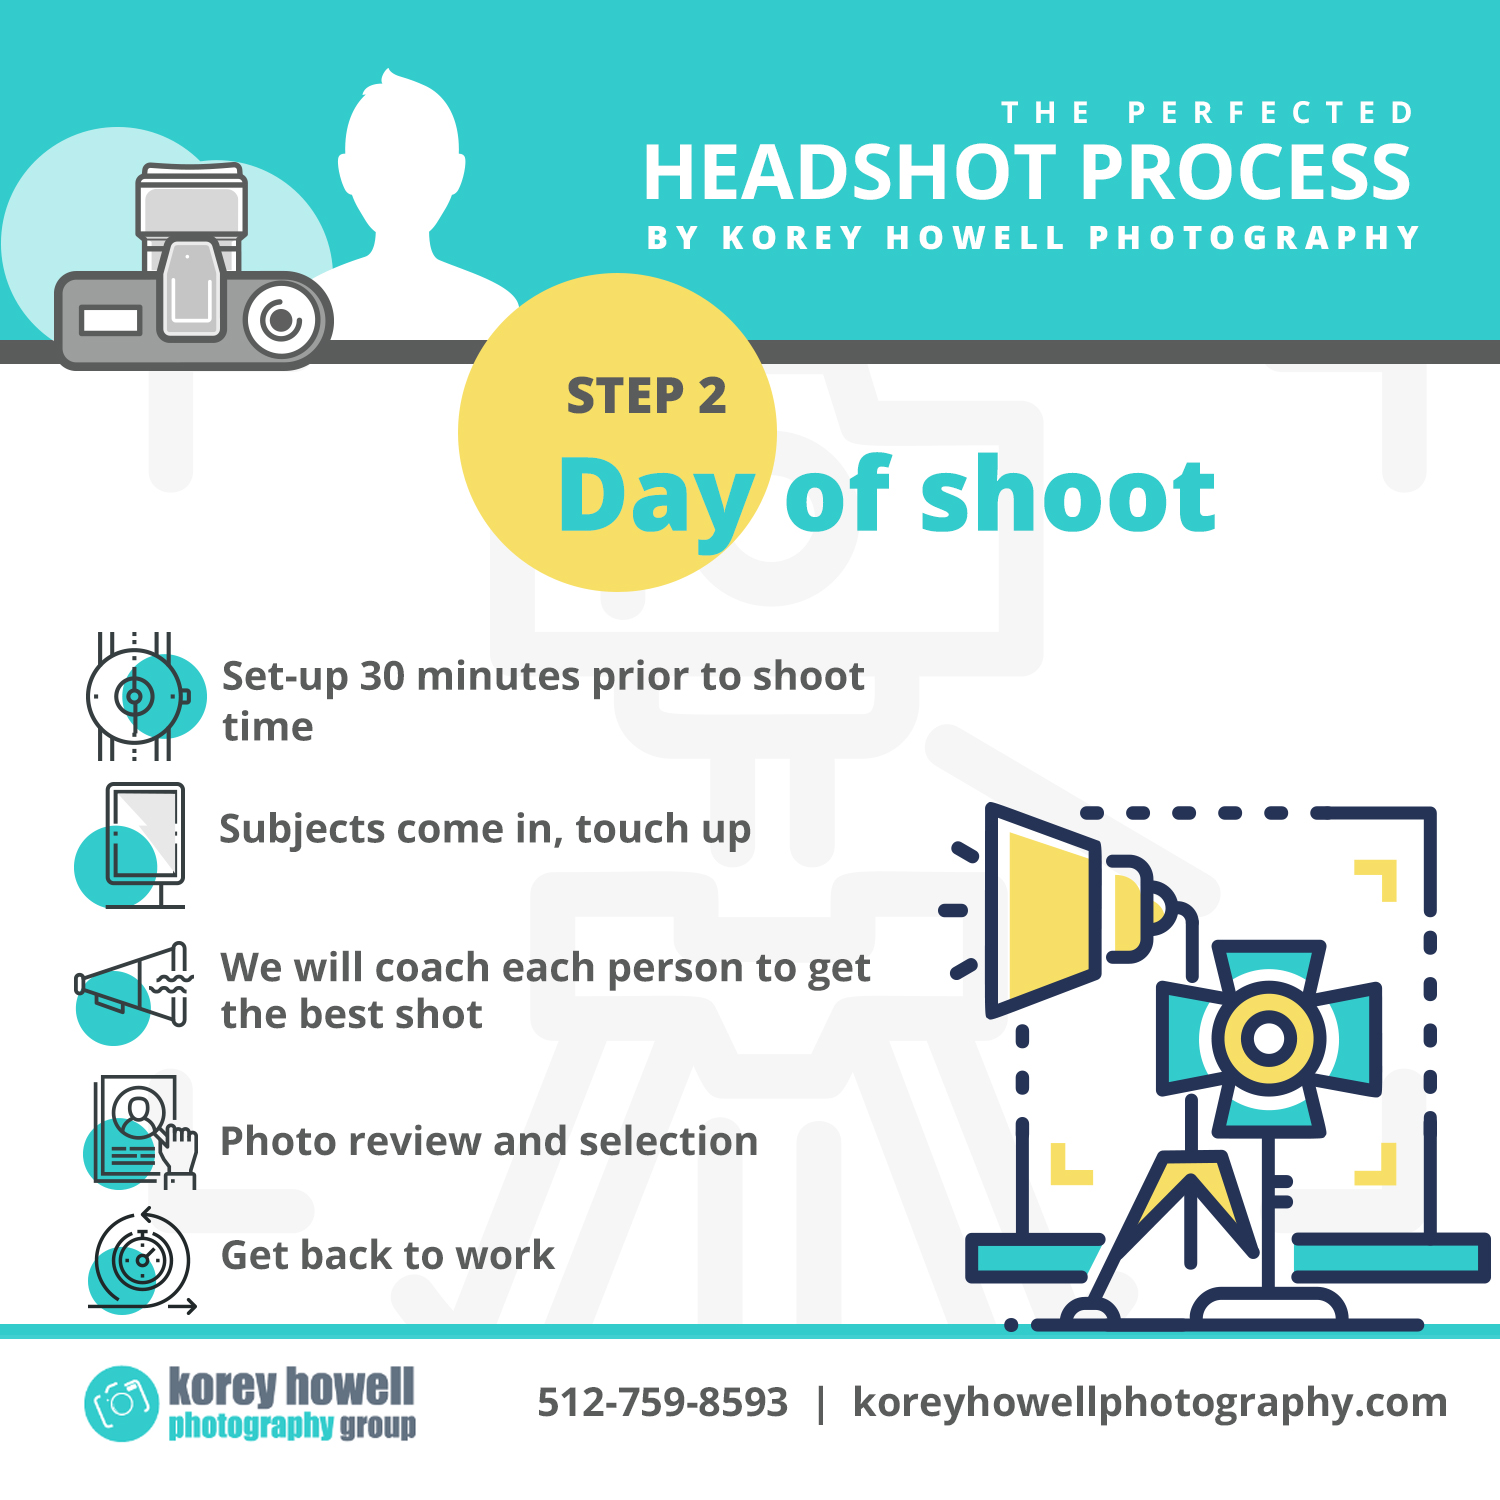
Take over social media by creating multiple small infographics instead of one big infographic. Or break down, a big infographic into smaller cards. This is because long-form infographics take up too much space and don’t look so great on social media. The best possible solution for you in such a scenario is to break down your big infographic into small social infographic cards. This will allow you to easily share your infographics on your Facebook, Twitter, Instagram and LinkedIn fans. So create small social infographic cards that are good to share and can create enough curiosity for users to click on and land on your website.

Level 6: Make Them Viral

Wondering what you can do to make your infographic more successful? There is! You can ask your infographic designer if he/she can post the created infographic on to infographic directories to generate more visibility. The infographic can also be used in its appropriate form on various discussion forums like Quora, Reddit, etc. Imagine how cool it will be to answer a question related to solar energy with a nice infographic as compared to plain text! The person asking the question will be happy and may even convert into a lead.

Level 7: Video Infographics

There is another evolved form of infographics and can be a lot more impactful than other forms of infographics, depending on the concept being explained. Explainer videos are a good example of video infographics. However be cautious of using video infographics as they are not SEO-friendly and may not be useful for posting in directories. Video Infographics can be a very good addition to your existing infographics. Here is an example of a static infographic as well as a video infographic.

Level 8: Landing Page (Unbounce) Infographic

Landing pages are very good tools for getting leads and generating business. However, you can enhance the purpose of your landing page even more, by using the art of visual storytelling and adding different-level infographics to your landing page. The infographic on the landing page can be used to explain a product, to provide important information or to present your work timeline. The power of infographics and landing page combined together can bring in better results than ever before! 

Now that you know the levels at which you can take your infographics, it’s time to start executing. You may try creating a few infographics online, but you will need a designer or an agency to handle complicated infographics. There are a very few infographic design agencies who can offer it all to you. To get a unique infographic that best suits your needs, you can easily get in touch with The Dreamer Designs. We are a passionate bunch of designers, researchers, and content creator and have been leading the space of infographics and have designed over 1200 infographics for brands like Mercedes, Nokia, Microsoft, CupoNation and more. You can also see some of the work we’ve done by checking out our portfolio.

types and forms of infographics

From Static to Video: The Ever Changing Forms & Types of Infographics

By Animated Infographic, Html Infographic, Infographic, Interactive Infographic, Static Infographic, Video Based Infographic
The Ever Changing Forms & Types of Infographics

Have you come across an infographic and want something similar designed for your company? Well, you’re in the right place. In this article, we will talk about the different types of infographics and their ever changing forms – from Static to GIFs to Videos.Since there are so many types of infographics, covering them in this article won’t be possible. Instead we’ll talk about the most popular infographic design formats in 2019 and how you can use them to shoot up your company’s online presence.

Read on to find out which type of infographic can best suit your business.

Static Infographics

Static infographics are the original informative infographics! These infographics subtly combine text and images to present a compelling story that attracts the attention of the audience. Generally used to represent difficult concepts and data into comprehensible chunks, static infographics work as great information providing tools. Most static infographics use graphs, maps, charts, and other such visual elements to present any given data. This data is then easy-to-grasp and retain owing to the findings that visual impact leads to more retention. 

Although all types of infographics share similarities with static infographics, the thing that sets them apart is that they are not interactive. A static infographic will only present your data is a linear manner, without needing any input or interaction from the user. This is a huge drawback for when user interaction is key. However, if you want to present information, static infographics can work quite well. 

Static infographics are quite popular as they help in representing data, visually. Information is conveyed from one end to the other in a creative format. With the easy availability of static infographic templates,

Types of infographic

users have been creating a lot of infographics. Problem is, these templates have been used so often and by so many people that they have become very common and fail to produce any reaction. If you want to create a static infographic, you should consider going forward with an infographics designer or an infographics design company to ensure the content you produce is always unique.

Animated Infographics, Popularly Known as Gifographics

Gifographic

Who doesn’t like GIFs? We see them, smile at them and share them. The perfect mix for anything to go viral – use that in your infographic and you’re good to go! Happiness aside, animated infographics are gradually becoming the best infographics owing to the unlimited creative scope they offer. We humans are hardwired to retain visual information, something that static infographics can achieve. However, if you add a little motion to the entire scenario, you get an infographic that is far more visually appealing than its static counterpart. This ensures that chances of retention go higher. 

Animated infographics are types of infographics that use animation to bring life to your static infographics. If you’re just starting out, you should pick the best static infographics that you have and recycle them with animation. You would, however, need a good infographics designer for this task. Recycling old infographics with animation makes your best content even more appealing and shareable. 

Animation also grabs user attention more quickly than static infographics. Anything that moves on the screen is bound to get a second’s worth of attention, and if your infographic stands out in that instant, it has the potential of going viral. A drawback that comes with animated infographics is that they can only be small, owing to the limitations of GIF creations. However, you can overcome this drawback by breaking down your one big infographic into smaller chunks, which to be honest are a lot better for social sharing!

Interactive Infographics

As the name suggests, interactive infographics are well, interactive. They allow users to manipulate and interact with infographics by asking users to select answers or icons to present information. The great thing about interactive infographics is that they truly engage with your audience, and not just capture their attention. With interactive infographics, you can have multiple storylines leading to different end results. This type of infographic allows the audience to dig deeper without losing out on the bigger picture. 

The drawback with interactive infographics is that you would require a programmer to create a good interactive infographic. A lot of infographic design companies, including The Dreamer Designs, create interactive infographics as per user requirements. They can easily help you create infographics that users interact with and get answers based on their selections. However, if your main goal is to provide linear information, sticking to static or animated infographics is the better option.

Interactive infographics are more likely to be shared on social media. If your audience interacts with your infographic, you have achieved in one go, attention and retention. The higher the interaction, the more chances of users retaining humongous information and then sharing it. This helps the basic-goal of an infographic which is to provide information. Another important point to note here is that interactive infographics allow you to capture data. As users interact with your infographic, they provide you with a lot of insights related to the information on the infographic, you on the other hand, get valuable user data which you can use to further your business.

Video Infographics

Videos in their own form, work as great tools for retaining information. According to a study, if you gain information from a video, chances of retaining are higher even after 24 hours. That in itself makes videos a great marketing tool. Video infographics work on the same model. If you create a video infographic, you will be providing a massive chunk of information to your users within a minute. This will allow users to retain more on the subject than with say a traditional static infographic. 

Videos are great in bringing forth an emotional connect if presented correctly. Building on the same approach,  video infographics allow users to easily connect with the 

information on the screen. If the video infographic is about a great cause, users will easily click on the share button. This tells us that video infographics are great tools for conveying information to large audiences. 

The drawback of the type of infographic that is in video format is that you will require a designer familiar with creating video infographics. Another drawback of video infographics is that they can be quite heavy, so uploading may also be quite a task. However, videos are becoming very popular on social media platforms, so going the video way is not a bad idea after all.

HTML based Infographics Or Web-based Infographics

There’s always Google to think about! If you want Google to crawl your infographic, it can’t be created in the traditional JPEG format. If it is, Google will mark your infographic as an image and be done with it. However, infographics definition is that they provide information, so shouldn’t this information be crawled and help with your SEO efforts? Well, it should! But for that, you will have to let go of JPEG infographics and move on to the latest HTML based infographics.

 HTML based or web-based infographics are becoming increasingly popular owing to their capacity of taking on challenges like responsiveness and SEO. Infographics created via code, keep intact the information provided on the infographic as text. This text is then easily crawled and indexed by search engines like Google, Bing, Yahoo and more.

HTML Infographic for Mercedes Benz

If you use a lot of keywords in your infographic, you will be able to use it to enhance your SEO efforts. All the information that you have worked hard on creating is easily searchable on Google, allowing a lot of users to land on your website. 

The only drawback with HTML based infographics is that they can’t be shared on social media. However, to counteract that, you can create a JPEG of your HTML infographic and add a link which leads directly to your website. HTML based infographics come with a lot less limitation than its static and animated counterparts. They can be all the types of infographics combined into one. 

Another great thing about HTML or web-based infographics is that they are mobile responsive. So even if you create a huge/long infographic, it will appear on your smartphone, exactly like it does on desktop. No zooming required whatsoever! HTML based infographics are types of infographics that are becoming the leaders in the infographics world as they combine animation and interaction to provide information. What’s more, an animated infographic created via HTML doesn’t have any size restrictions!

Conclusions

Now that you’re aware of the types of infographics there are, it’s time to select the best infographic type for your business. If you want to provide linear information, go with a unique but static infographic. If however, you want your static information to capture more attention, your best bet is an animated infographic. Wondering about how to provide massive chunks of information? Go the video infographic way. If you need users to answer questions or to interact with your audience and want to capture data, go with interactive infographics. Coming down to the last one, if you want all the best features of all the infographics, stick to or start with HTML based infographics. These infographics pick the best qualities of all types of infographics and present them in an interactive format, they are searchable by Google and are mobile responsive. 

So don’t wait! Pick the infographic that works best with your business at the moment and go with it. You can create infographics using tools available online, however, those can be quite common. To get a unique infographic that is video, interactive or HTML based, you can easily get in touch with us, The Dreamer Designs. With a great team of designers, researchers, and content creators, we have been leading the space of infographics and have designed over 1200 infographics for brands like Mercedes, Nokia, Microsoft, CupoNation and more. We can help you create compelling infographics and are always up for a chat! 

HTML Infographic for Mercedes Benz

8 Things that You Must Not Miss when Hiring an Infographics Designer

By Animated Infographic, Crowdfunding Infographic, Html Infographic, Infographic, Interactive Infographic, Static Infographic, Video Based Infographic
8 Things that You Must Not Miss when Hiring an Infographics Designer

The infographic design space has been part of a major evolution and is one of the most time-tested ways of delivering your message to various audiences. Infographics mainly comprise of visual clues to communicate the intended message while ensuring that it stays relevant to the topic.

But before you join hands with the Infographics revolution and get added to the list of people being benefited by the extreme communicative power of this tool, it is essential that you hunt for the right infographic designer for your business. Listed below are a few but crucial things to look out for when hiring an infographics designer:

  1. Purchased Images

The designer should use licensed vectors and images in order to avoid copyright issues which can cost you tons. Most designers use images from so-called “free” websites like Freepik and use an image like the one in the below example. However, the detail that they miss is that attribution is required for using this image. This can lead to serious trouble if your infographic goes viral. Which exactly is the purpose behind designing it!  

Same is the case for fonts where infographic designers use fonts from sites like Dafont which provide some fonts for free but for personal-use-only license. It should be ensured that the designer is willing to share the licenses for all fonts, vectors and images used while ensuring that all assets used are good for commercial purposes. You really don’t want your infographic to be a matter of worry and legal issues when you have already displayed it on your platform for the world to see!

  1. Variety of Styles in Portfolio (flat style, process-based, data-based)

Infographics can be designed for a variety of purposes. You can ask an infographics designer to create an infographics resume , to illustrate a process , or to simply provide information about a product  or a service . Infographics can also be used to list down the top 5 – 10 USPs or so of a particular product or to compare two similar things visually.

Infographics can not only be created for a variety of purposes but also in a variety of different styles. To give you an idea, Flat Style Infographics  provide good quantity of content at a low price making them perfect for when you want to only provide information. Image based infographics. on the other hand are good for product based infographics and for more professional industries like the medical, finance etc.

Although there is no fixed-style for an infographic, the designer should know what style will help bring in higher conversions. Infographics that resonate with the target audience tend to bring in higher conversions, something that your infographics designer should be well aware of. Along with that, the design should complement well with the overall style of the brand or product that he/she will be representing via infographics.

  1. Ability to Level-Up Infographics When Needed (animated, interactive, responsive infographics)

Did you even know there is more than jpeg images when it comes to infographics?  Your designer created an infographic, shared it with you in a jpeg format, you posted it on social media and mostly received a positive response. However, you also got feedback that the infographic could have been more interesting but alas, you don’t know what to do with this excellent piece of information. Worry not!

There are several options that can be used to level-up your infographic and these options should be your designer’s first go-to. You can reuse the infographic with animation  and make it mobile-friendly. Yes, there are ways in which you can make your infographics mobile responsive and SEO-friendly ! If in case you have a content-heavy infographic, you can repurpose it for social media by converting it into social cards . Your designer should be able to help you scale-up and extract maximum out of your infographic.

  1. Infographics Created are Mobile Responsive & SEO-friendly

Check with your designer if the infographic created is mobile responsive and SEO-friendly to save yourself a lot of trouble. With mobile-first being the trend in the industry, you must ask your designer if they can convert infographics into a mobile responsive design via HTML so Google crawlers can read through the text. This will also allow your infographics to help you in your SEO efforts. You can use this infographic as an example  and request the designer to check the created infographic on both mobile and desktop.

  1. Beware of Template Based Designs

You must ensure that designers don’t create infographics for you using ready-made templates as that will kill the purpose of creating the infographic in the first place. The real purpose of an infographic is to present information in a unique and customized manner so that it tells your story. The designer should not fit your story in a ready-made template.

With a variety of drag-and-drop infographic builders in the market, designers can take this path. The problem with this is that owing to limited resources and tools, infographics created via drag-and-drop builders are never unique. Most of the infographics end up looking exactly similar and you probably don’t want your infographic to look like it was inspired from your competitors.

  1. Integration with Existing Systems (HTML, WordPress, Unbounce)

Before you go ahead with a designer, you must consider whether or not the infographic created is good enough to be part of your website or marketing plan? Can it be sent as a landing page using Unbounce or can it be part of your WordPress website ? You must consider if your infographic falls in line with your marketing efforts and if it be integrated with your existing brand guidelines?

  1. Experience with Infographics & Success Stories

How can your designer guarantee that the infographics they create are liked by your target audience? Truth is, they can do no such thing, however, they can provide you with proof of past success which can back up their claim. For example, infographic resume for Ben Fisher is an infographic that has been featured at various places across the web and is liked by many. You can also ask designers for their work experience, portfolio and the names of the brands they have worked with in the past.

The number of infographics worked on is also a good decisive factor when selecting an infographic designer. A designer with more than 1000 infographics designed can be considered to be a safe choice.

  1. Cost

You may wonder if an infographic designer will charge more if they have worked for big brands in the past. In order to get an idea, we will provide you with an industry cost of a basic infographic so you can negotiate better. For example, a static infographic for approx. 700×3000 px like this one should cost you around USD 200-300 depending upon the volume and timeline. The price will however increase with additional features like animation, mobile responsiveness, SEO-friendly design etc.. However, now that you have a fair idea regarding the cost, you can begin your search and negotiation from there.
Now that you know the points to consider when hiring an infographics designer, you must be ready to go ahead! However, if this seems like too much information you can always hire professional teams to take care of your infographics and other design requirements. When investing your time, effort and money, you must consider whether or not it is all worthwhile. Hiring professional ensures that the work you get is unique and tells your story in the best manner possible. If you want to hire great designers, you can get in touch with The Dreamer Designs , a company that understands all these things in detail and has years of experience in the infographics industry. Chances are that they already have infographics relevant to your business needs.

Solving the age-old problems of infographics

By Html Infographic, Innovation
HTML based infographics header

The other day I sent one of the infographics I designed, to a friend of mine and he happened to open it up on his phone. As I thought, he simply hated it. On his phone, he could not understand a word of it, as the image appeared too small. The way infographics are designed in the industry, they are not responsive and with the world going mobile, infographics are losing their charm. Once they ruled the industry as visual information is better understood than the textual one, but the times have changed.

What if it could be changed. What if your infographics could adjust to screen size? The possibilities will be endless. What if the same visual appeal can be carried irrespective of the screen and resolution used?

The second biggest challenge or as Marketing Guru Neil Patel rightly mentioned in his post: https://www.quicksprout.com/2017/07/21/heres-how-to-perfectly-optimize-your-infographic-for-seo/

The article reads like” Let me start by saying infographics are technically just images. They are typically saved in image formats such as JPEG, PNG, GIF, etc. Of course, they’re much more robust and contain far more information than a regular image, but that’s how Google views them. This is important to know because Google can’t “read” images like it can text-based content such as a blog post. ”

Now there is a solution and that too without breaking a bank. With HTML based infographics we are able to solve this age-old problem with infographics while ensuring that they are stunning to look at and yes, they are SEO friendly as well. Majorly all the text included is crawlable by search engine crawlers. It can have HTML tags like H1, li etc. The infographics we design in this category are mobile responsive and can have animation as well. We have successfully implemented these infographics on WordPress based websites as well. Moreover, they are much lighter on the page than a big image or a gif.