Category

Infographic

How to run a successful crowdfunding campaign?

By Crowdfunding Infographic, Infographic

Crowdfunding began in churches, where a basket would be passed around and funds would be collected for some greater good. Fast forward to the age of the Internet, where crowdfunding campaigns gained popularity and appealed to a larger community for funds. It became easier to find a crowdfunding campaign that you truly believed in and wanted to support. With multiple platforms like Kickstarter, Indiegogo and more, launching a crowdfunding campaign became easier. Gaining support, however, got tougher. 

With increasing number of crowdfunding campaigns, the fight to gain page views and pledges has become difficult. This is especially true for platforms that have thousands of campaigns competing against each other. To run a successful crowdfunding campaign, you need to identify some of the best techniques, marketing strategies and trade secrets. Passing along a basket won’t be enough. 

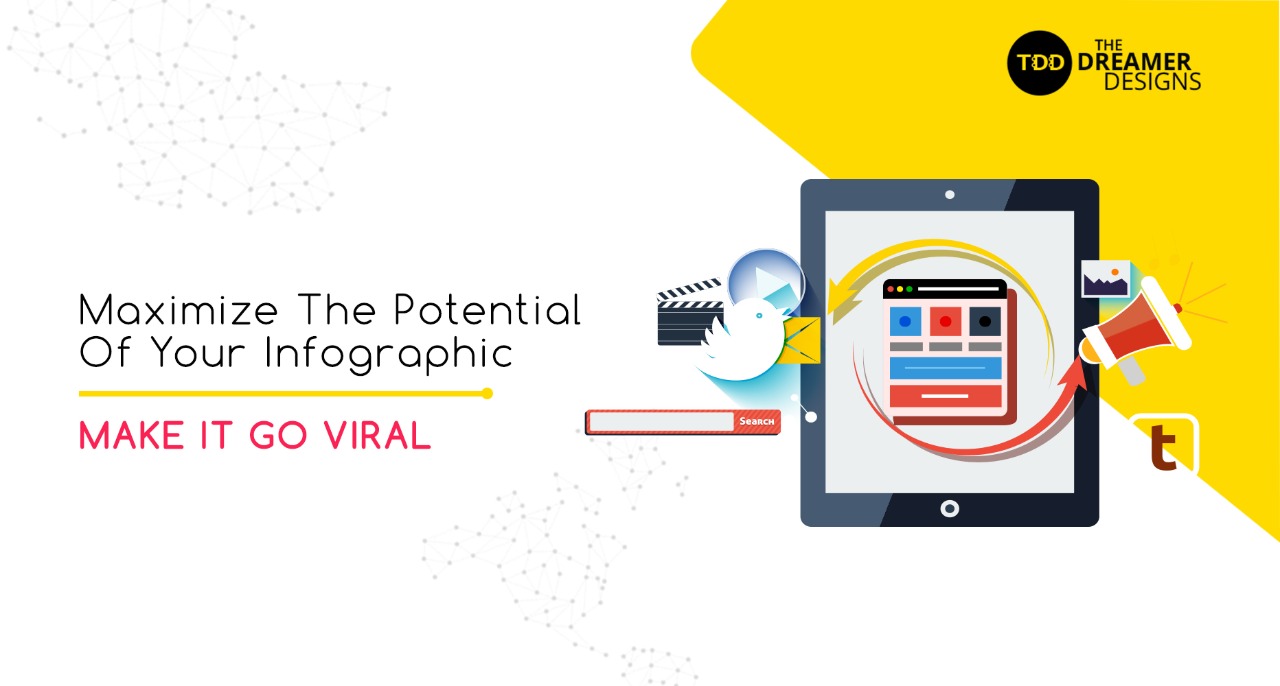
To run a successful crowdfunding campaign you need an impactful storyline that stands apart from the crowd. It must be something that catches the attention of users and pushes them towards taking action. However, most crowdfunding platforms have a lot of text and design limitations. The only way to beat them and ensure that you stand out, is to invest in Infographics. Infographics can be uploaded onto crowdfunding platforms and can be used to attract the attention of users and make them take action. Listed below are ways in which you can enhance your crowdfunding campaign, use multiple platforms to gain an audience, highlight your brand, tell a compelling story and more, by inculcating infographics in your crowdfunding campaign.

Use visual elements to leave a lasting impact on your audience

According to research, humans are visual creatures and tend to remember and recall visual elements far more easily than words they read. If your aim is to leave a lasting impact while competing against thousands of crowdfunding campaigns, you must stand out. Infographics are striking and can visually tell a story. Another reason for using infographics instead of just text on any crowdfunding platform is to skip endless limitations. Most crowdfunding platforms are restrictive of formatting. You may not be able to change the font type or size of the text explaining your campaign. You may also not be able to add bullet points, change alignment, shuffle text placement, and more. A lot of these formatting limitations take away from the story you want to tell. This is where infographics can help. You can do anything you like with your infographic and not worry about design or formatting limitations. Create an infographic, upload it on to a crowdfunding platform, and you’re good to go!

Present your data via graphs, charts, pictures and tables

Crowdfunding campaigns are the opposite of mainstream business finance. Instead of pitching your idea to a limited number of individuals with money, it allows you to present your ideas to people from all over the world. Crowdfunding platforms allow entrepreneurs to share a pitch with interested parties, offer them investment options or other rewards. To get an audience to understand your idea, you need to create a pitch that doesn’t bore your audience. Infographics are great because they allow you to add elements like graphs, charts, tables and pictures in a fun and creative manner. They allow you to breakdown financial jargon into easy-to-understand data that can be understood and acted upon by your audience.

Tell a compelling story to build trust

Online crowdfunding campaigns give you just over a few seconds to leave an impact. Can you do that with just words? Maybe not. The truth is, you need to be different from compelling pitches, creative ideas and heart-wrenching stories. To run a successful crowdfunding campaign, you have to tell a story that makes your audience pause and notice. With the help of infographics, you can keep in touch with your supporters and inform them of your project’s progress. This will help build a long-term relationship and transparency will help you gain trust.

Gain a presence, everywhere

Don’t limit your crowdfunding campaign to just crowdfunding platforms, use the power of social media to gain more supporters. What’s more? If you go the infographics way to launch your crowdfunding campaign, you don’t require any other material for social media. Infographics, once created, can be shared on social media platforms, and they have a history of going instantly viral! You can create multiple infographics, test which infographics work best for you and your project and then launch the same on crowdfunding platforms. This will allow you to gain the maximum traction and help you run a successful crowdfunding campaign.

Conclusion

The secret of running a successful crowdfunding campaign is very simple – impact. If you have a compelling story and the ability to make an impact, you can run a successful crowdfunding campaign. Infographics are one of the most popular mediums via which you can grab the attention of a user. If you can use infographics to present your story, chances are you’ll reach your campaign goal, far quicker. We know this because we have been creating infographics for a while now, and have created successful crowdfunding campaigns for clients like Bomfy B, Noveli, Reach App and more. To get in touch with us, The Dreamer Designs, please click here.

What’s the ROI if $500 Infographic Can Help You Sell One Car a Month?

By Infographic

Must read for automobile dealers

If you’re in the car-selling business, you must be aware of the competition that exists between automobile dealerships. With everyone offering the same product at the same price, there is hardly room to upsell anything. To stand out, you must offer outstanding customer service to buyers as well as potential buyers. If not, your customer could purchase the same car from someone else. 

Since it’s an online world, customer service begins the moment a person visits your website and not just your dealership. According to a report, buyers that purchased cars 10 years ago visited about 5 dealerships before finalising a purchase. Today, most buyers only visit 2 dealerships. This is because over 62% of automobile buyers prefer to spend time researching online, and only 29% prefer speaking to a sales representative. These figures indicate that the industry is changing, and the best way to connect with millennials is to go online.

Creating a marketing strategy to reach out to potential customers is a great idea. However, your marketing strategy should be such that it makes buying a car, a seamless and easy process for our customers. One of the ways of doing so is by including automobile infographics in your marketing campaign.

Infographics are designs that present complex information in an easy-to-understand and unique manner. Car infographics are also gaining momentum in the automobile industry all over the world. For example, this automobile infographic was created for Mercedes Benz dealership and was approved by the media compliance team of Mercedes during quality check. This car infographic garnered a lot of interest and provided the dealership with a great return on investment. 

According to a report by analysts at Kelly Blue Book, the average cost of a car in the United States is $36,000. As an automobile dealer, if you were to invest $500 in creating a set of automobile infographics, you could use those infographics to promote the car on different platforms, provide great customer service and generate a return on investment, even if you sold only one car. 

To stand out in the competitive world of automobiles, you must do something different. With the automobile industry still being largely untapped with automobile infographics, the margin to stand out and succeed is quite high. When creating a car infographic, you only need to adhere to the brand guidelines and ensure that the infographic is in sync with your product. Once that is done, you’re good to go. 

Currently, there are numerous types of infographics, such as static, animated and gifographics which can help you target different types of customers. All of these types of infographics also come with numerous design formats that can be utilized to highlight segments of a car or statistical figures. In this article, we will try to show you how investing in automobile infographics can help you:

  • Generate customer interest
  • Offer outstanding customer service
  • Beat the competition
  • Ensure long-term customer relationship

Generate Customer interest

Automobile infographics are great tools to generate customer interest from the get-go. As a dealership, your potential customer is someone aware of his/her need to buy a car. Your potential customer could also be someone who has been facing issues with his/her current mode of transport. As per a report, 75% of potential buyers start researching online the moment they become aware of their needs.

Although there is a lot of information online related to automobiles, most of it requires watching videos or reading articles, both of which are time-consuming tasks. Automobile infographics, on the other hand, save time and present complex information with panache. One such example of the proper utilization of infographics in the automobile industry is listed below. 

Create a car buying guide: Providing important information like ‘steps for buying a car’ can be done via car infographics. Process infographics use a combination of colours and elements to provide stepwise instructions to any audience. A car buying guide should answer questions related to budget, vehicle type, essential features, financing options and more.

Visually-represent benefits: You can make use of a timeline infographic to show the benefits of buying a car or a long-term mode of transport that saves money in the long-run. Different types of automobile infographics can help you attract customers and generate interest in not just the listed car, but also in you as a dealership.

Offer Outstanding Customer Service

As per the same report, 45% of users who look for deals online are inclined towards converting. One way to provide outstanding customer service is to help customers in their buying process. Once a customer has made up his/her mind about buying a car, the process leading up to the actual purchase must be seamless. This can be done by providing the following information to users via different types of infographics:

Variant information via Comparison Infographics: Help your customer make a smart choice by representing variants via infographics. Comparison infographics are mostly split vertically or horizontally to offer clear comparison notes. These automobile infographics use design elements to highlight important features which make taking a decision, easier.

Visual representation of technical specifications of the car: Data visualization makes it easier for consumers to identify key factors that may go unnoticed otherwise. If represented correctly, these factors can drastically change the way customers gain technical information. This could not only be a gamechanger for a dealership but may even drive sales by people apprehensive of buying a car. You could also provide customers with an infographic checklist which helps them in remembering all the provisions that the automobile comes with. 

Providing important information in an easy-to-understand format can inform customers that you are a dealership that cares, or invests in educating its customers. This offering could easily build trust with your dealership and may increase the overall footfall

Beat the Competition

Another way to stand out in the crowd is to provide a shout-out of all the work you have done and intend to do in the automobile industry. Use the power of automobile infographics to visually highlight your achievements, best practices, sales figures and more. You can create one specific infographic, like a statistical infographic which is used to show data. This type of infographic could show faster delivery time, popularity statistics, quick response time, deals and more. Utilizing these types of infographics could drive business to your automobile dealership instead of just any.

Ensure long-term customer relationship

In the automobile industry, an average car runs for 11 years, with around 58% drivers intent on running their cars into the ground. In the competing market of automobile dealers, ensuring long-term customer relationship is a tough task. However, creating car infographics that help customers after they have made a purchase can generate some of the best word-of-mouth marketing on social media and other places. To build a relationship, you must initiate a conversation that lists different ways of keeping your car in its best shape. Infographics that you could create are:

Service station checklist: Post-purchase, you can share with your customers a car infographic that provides information regarding nearby service stations. This could be done via Informational Infographics.

Car hacks: You could make use of all your acquired automobile knowledge to help designers create automobile infographics that offer great car hacks. These hacks could range from car care infographics to how to quickly fix things for when you are stranded somewhere. Your car hacks infographic could also include secret tips to improve performance.

Your chances of standing out and gaining valuable customers that offer word-of-mouth marketing can be astounding for your dealership. No wonder companies like Mercedes Benz and associated dealerships are actively investing in different types of infographics. 

Conclusion

To stay ahead of all other dealerships, you must invest in cost-effective methods to increase customer engagement, footfall, and retention. While you do that, you must also face a very competitive environment. To stand out and increase the number of your sales, you should invest your money in getting automobile infographics created. One set of infographics for a car can help you reach out to hundreds of online customers! A lot of infographics that talk about your dealership can be used for more than one car even. This will not only help you attract user attention but will also help you in ensuring long-term customer retention. With different types of infographics to choose from, you can be lost for choices. If you want, we can take you through the process and also help you create different types of infographics. To get in touch with us, please click here.

Representing Data Using the Right Infographics Design Format

By Infographic

Every infographic tells a story, it’s upon you to decide the best way to deliver it. With so many infographic design formats available in the market today, making that choice can be difficult. This is why we have put together an article that answers all design related infographic questions.

If you want your content or data to make an impact, you must first choose the type of infographic you want before narrowing down on its design. The online world has seen a boom in infographic types, from static to gif-based, with different designs for all. In this article, we will talk about the most popular design formats available in the market today and their best use-case when representing data or any form of content.

Informational Infographics

Not interested in talking endlessly about a topic? Try creating an informational infographic. These types of infographics are helpful when you have a concept that requires clarification, a new product that requires introduction or if you just want to inform people about a certain matter or situation. 

An informational infographic keeps it simple. It visually represents information in points, making it easier for users to grasp and retain hordes of information. Most informational infographics narrate a story that tell you more about the product or a service.

Statistical Infographics

Have you accumulated a lot of data from surveys? Try representing the main data points via statistical infographics. These infographics highlight the statistics that are important, and since they are visually represented, recalling numbers becomes easier. 

Statistical infographics help save time in board meetings and allows people to move away from boring excel sheets. With the ready availability for unconventional designs, experimenting is a lot easier. With the help of statistical infographics, your data can make the impact it was collected for.

Timeline Infographics

Wondering how to give an overview of important dates for your business? Your best bet is a timeline infographic. Used to highlight the history of something, timeline infographics use lines and colours to take readers through the entire timeline. In fact, this technique works because humans tend to understand time with relation to space. 

Timeline infographics offer a clearer picture of a timeframe, and can be readily used to highlight important dates and events for you career, personal life or business.

Process Infographics

Want people to follow certain steps or processes? Try showing that information using process infographics. These infographics make use of numbers, colours and other such techniques, to provide step-wise information to the audience. To help with the flow, some designers even use arrows, colour gradients and line, that point users in the right direction. 

Process infographics can be quite beneficial as they can help you define processes. They can even be used for presentations where you show a journey of a user, product or feature.

Geographic Infographics

If you have data from around the world, you can use geographic infographic to visually present that information. With the help of heat maps, you can present data and leave quite an impact. These infographics can also be used to compare data from around the world, provide destination specific information and breakdown numbers for ease of consumption. 

These infographics are different from informational infographics because they use maps to represent data obtained from the world over. This representation makes it easier to compare and analyse data by specific locations.

Comparison Infographics

Popular for helping people make the right decisions, comparison infographics are typically split horizontally or vertically with items for comparison on each side. These infographics are perfect for helping people see the USPs of products or to provide information on two options. 

It’s a game of choice with comparison infographics and the best thing to do in such cases is to stay neutral. Contrasting colours are used to highlight differences as well as similarities, depending on the final goal.

Resume Infographics

In a fast-paced industry, applying for a job can seem scary. With growing competition and unemployment rates, it’s important to stand out from the crowd. Resume infographics are gaining popularity because they highlight important skills and experiences of candidates in a format that is pleasing to look at. These types of resumes also tend to stand out more than traditional resume formats. 

Resume infographics, if designed correctly, can reflect your personality from the beginning itself. With the help of company logos, icons and data visualization techniques, it’s easy to make yourself a prominent candidate, because the chances of your experience making an impression, are quite high.

Conclusion

With so many design formats available in the market, it can get difficult selecting and creating an infographic that best suits your purpose. The best way to begin is to see what type of information you wish to provide to your audience. Ask yourself if the goal is to provide information or to gain information. Once you know what you want, you can easily refer to the above information to better represent your data. If you would like to get your infographics designed by a team of professional infographic designers, you can get in touch with us. With a great team of designers, researchers, and content creators, The Dreamer Designs has been leading the space of infographics and have designed over 1200 infographics for brands like Mercedes, Nokia, Microsoft, CupoNation and more. We can help you create compelling infographics and are always up for a chat! 

Why Hiring an Infographics Design Company is a Better Choice for Your Business?

By Infographic

Before you say, ‘Waste of money!’ hear us out! We’re well aware that there are several drag-and-drop infographic builder tools that advertise things like ‘Build an Infographics in Minutes’. And they’re not wrong. With a templatized format, you can easily push stuff around and create a brilliant looking infographic. However, there’s a catch! 

The problem with an infographic created via a drag-and-drop infographic builder, is that it may not always be unique. It might actually turn out that your competitor is using the same template from the same infographic creator tool, to promote something similar. And we all know that standing out in this fast-paced world is very important. Going with an infographics design company ensures that you get an infographic that is unique, personal, and only yours. It might even set the design and layout for all your future infographics. So taking that first step towards creating unique infographics, can be the starting point of going viral! 

Coming back to infographic creator tools, a general opinion is that they’re actually quite easy to maneuver and provide users with ready-made templates. However, the problem with that is that these templates can’t always be twitched according to your preference. More often than not, there are limitations to what you can do with any single template. Just like website builders, you’ll be able to change the colour and font, but the sticky bar that annoys you, will stay! In fact, you might even have to hire an infographics designer to change a few things. However, unless created from scratch, the chances of an infographic standing out are pretty slim. Don’t believe us? Click here and see some infographics that have been created by designers from the get-go. Working alongside infographic designers and infographic design companies ensures that your ideas are heard and understood to create an infographic design that best suits your business.

Advertised as ‘take a minute to create an infographic’, most infographic creator tools aren’t always simple. Understanding how they work can be time-consuming, especially if you’re not a tech-savvy person. You may have to spend hours trying to figure out how things work, the changes that you really need, and may even have to scrape your work over and over. This process is not just time-consuming but also tedious. Hiring an infographics design company in that regard is the best solution. They’ll save you time. Period. Since most infographic design companies have a team of infographic designers, getting work done on priority won’t be a problem. In fact, most infographic design companies are essentially design companies, and can help you with all your design requirements. You’ll build a long-term relationship with a company that will help you in creating your website, social media posts, banners, infographics and more

Another important factor that people tend to forget is scalability. In order to create bulk infographics, you will either have to spend endless hours on infographic tools or hire someone else to complete the task. Lack of new infographic designs will also start becoming a problem. In such a scenario, you will be stuck and would want to hire an agency that can sort out your designs. Going to an infographics design company late in the game, may turn out to be counterproductive. You would have already published so many infographics that aren’t unique, your one unique infographic might not stand out. Or maybe it would. It’s a thing you will find out later. Scalability requires teamwork. Infographic design companies come with a team of professional infographic designers, thereby ensuring that your work is scalable and can be personalized according to your preference. It’s not a one-size-fits-all approach with them. Their infographic designs are unique, and have the capability of going viral, instantly!

All the above mentioned things aside, an infographics design company can help you create a brand. If you’re passionate about your business and are creating infographics to solve a purpose, it’s better to go for a unique infographic that can make an impact. This will help you in catching the eye of the right customer thereby ensuring higher CTRs. An infographics design company helps you add that personal touch to your infographics, while making them stand out. Another great thing about these infographic design companies is that they can help you create different types of infographics, not just simple static images. With an infographics design company, you can get unique SEO-friendly infographics that are also animated. You can even opt for video infographics. The choice is yours.

An infographics design company has the backing and experience to help you create potentially viral content. You just need to find one that suits your requirements. If you want to know more about the benefits of hiring an infographics design commpany, you can get in touch with us. We have worked with brands like Mercedes, Nokia, Microsoft and have helped them with their infographic requirements. If you’re planning to expand your business, speak to us about your infographic design requirements, because we can help.

Maximize the Potential of Your Infographic, Make it Go Viral!

By Animated Infographic, Html Infographic, Infographic, Interactive Infographic, Static Infographic, Video Based Infographic
Maximize the Potential of Your Infographic, Make it Go Viral!

An infographic is a lot more than just a JPEG which looks good and conveys the information in an appealing form. Apart from that, it can be used in many more ways than just a post on your website or a social sharing item. With so many types of infographics in the market today, it’s important to choose the right one for your business.

If you’ve ever seen an infographic on your phone you must know how uncomfortable and unimpactful it can be. You may have had to zoom everything, which would have killed the impact of the infographic in that very instant. In many cases, if you share a very long infographic on social media, it may hamper your feed more than helping it. The reason behind this is that most infographics are not mobile responsive, which makes the text on the infographic look extremely small. Same is the case when a long infographic post is shared on social media channels like Twitter. Honestly, I have seen many successful people doing this.

So is there a brighter side to it?

Absolutely. Infographic designs have evolved over time to provide solutions that are mobile mobile-friendly. In this article, however, we will focus on how you can use infographics more effectively to maximize outputs.

Here are various forms an infographic can elevate to. 

Level 1: The basic JPEG

Level 2: Animate it and make it impactful

Level 3: Make it responsive with HTML

Level 4: Add Animation To HTML Infographics

Level 5: Make it socially shareable

Level 6: Make it viral

Level 7: Make a video infographics

Level 8: Extreme: Make a landing page using infographics to 10x your marketing efforts

Level 1: The Basic Form

Keep JPEG as your chosen format style with an average dimension of 700 pixels by 2000 pixels. Creating a good JPEG infographic is key because you can easily place it anywhere on your website and it can serve as basics for taking your infographic to the next level. The infographic is also great for sharing on websites like Pinterest and for uploading on infographic directories.

Level 2: Make Them Impactful

Gifographic

If you want to make an impact, you must stand out. Adding animation to your infographic allows you to capture the attention of your user, even if it’s for one second. While the same infographic can be shared as an image, making it animated catches the attention even more than a static infographic. 

This is a fine and effective way of repackaging an infographic if you do not have the time or the budget for a video but want to avoid making a static infographic. Remember that GIF infographics, also known as gifo-graphics and animated infographics are a bit small as compared to static infographics. This is owing to the limitations of the GIF creation process.

Level 3: Make Them Responsive

The good news is, you don’t have to restrict your infographics to JPEG images and animated GIFs, instead you get them created in HTML. What this does is, it makes your infographic mobile-responsive. So, your infographic looks the same on desktop and it looks great on your phone as well. 

Remember, you will still need static infographics along with HTML ones for posting them on directory listings. So, ensure that you hire an infographics designer who can convert a static infographic into an HTML one without any visible difference.

Once you get an infographic created in both formats, you can use the static one for posting on infographic directories and the HTML version for your website. Another benefit of having an HTML infographic or web-based infographic is that it is SEO-friendly. This means that Google crawlers

can crawl through the text written on your infographic and help with your SEO-efforts. Read more about it here.

Level 4: Add Animation To HTML Infographics

There is a bit of difference in Level 2 & Level 4. After creating a gifographic or an animated infographic, you can easily convert it into an HTML version. What this does is that it removes the ‘size’ limit from the animated infographics, so you can create one big infographic made up of many small ones. To be clear, there is no restriction on size when creating HTML infographics.

Level 5: Go Social The Right Way

Take over social media by creating multiple small infographics instead of one big infographic. Or break down, a big infographic into smaller cards. This is because long-form infographics take up too much space and don’t look so great on social media. The best possible solution for you in such a scenario is to break down your big infographic into small social infographic cards. This will allow you to easily share your infographics on your Facebook, Twitter, Instagram and LinkedIn fans. So create small social infographic cards that are good to share and can create enough curiosity for users to click on and land on your website.

Level 6: Make Them Viral

Wondering what you can do to make your infographic more successful? There is! You can ask your infographic designer if he/she can post the created infographic on to infographic directories to generate more visibility. The infographic can also be used in its appropriate form on various discussion forums like Quora, Reddit, etc. Imagine how cool it will be to answer a question related to solar energy with a nice infographic as compared to plain text! The person asking the question will be happy and may even convert into a lead.

Level 7: Video Infographics

There is another evolved form of infographics and can be a lot more impactful than other forms of infographics, depending on the concept being explained. Explainer videos are a good example of video infographics. However be cautious of using video infographics as they are not SEO-friendly and may not be useful for posting in directories. Video Infographics can be a very good addition to your existing infographics. Here is an example of a static infographic as well as a video infographic.

Level 8: Landing Page (Unbounce) Infographic

Landing pages are very good tools for getting leads and generating business. However, you can enhance the purpose of your landing page even more, by using the art of visual storytelling and adding different-level infographics to your landing page. The infographic on the landing page can be used to explain a product, to provide important information or to present your work timeline. The power of infographics and landing page combined together can bring in better results than ever before! 

Now that you know the levels at which you can take your infographics, it’s time to start executing. You may try creating a few infographics online, but you will need a designer or an agency to handle complicated infographics. There are a very few infographic design agencies who can offer it all to you. To get a unique infographic that best suits your needs, you can easily get in touch with The Dreamer Designs. We are a passionate bunch of designers, researchers, and content creator and have been leading the space of infographics and have designed over 1200 infographics for brands like Mercedes, Nokia, Microsoft, CupoNation and more. You can also see some of the work we’ve done by checking out our portfolio.

types and forms of infographics

From Static to Video: The Ever Changing Forms & Types of Infographics

By Animated Infographic, Html Infographic, Infographic, Interactive Infographic, Static Infographic, Video Based Infographic
The Ever Changing Forms & Types of Infographics

Have you come across an infographic and want something similar designed for your company? Well, you’re in the right place. In this article, we will talk about the different types of infographics and their ever changing forms – from Static to GIFs to Videos.Since there are so many types of infographics, covering them in this article won’t be possible. Instead we’ll talk about the most popular infographic design formats in 2019 and how you can use them to shoot up your company’s online presence.

Read on to find out which type of infographic can best suit your business.

Static Infographics

Static infographics are the original informative infographics! These infographics subtly combine text and images to present a compelling story that attracts the attention of the audience. Generally used to represent difficult concepts and data into comprehensible chunks, static infographics work as great information providing tools. Most static infographics use graphs, maps, charts, and other such visual elements to present any given data. This data is then easy-to-grasp and retain owing to the findings that visual impact leads to more retention. 

Although all types of infographics share similarities with static infographics, the thing that sets them apart is that they are not interactive. A static infographic will only present your data is a linear manner, without needing any input or interaction from the user. This is a huge drawback for when user interaction is key. However, if you want to present information, static infographics can work quite well. 

Static infographics are quite popular as they help in representing data, visually. Information is conveyed from one end to the other in a creative format. With the easy availability of static infographic templates,

Types of infographic

users have been creating a lot of infographics. Problem is, these templates have been used so often and by so many people that they have become very common and fail to produce any reaction. If you want to create a static infographic, you should consider going forward with an infographics designer or an infographics design company to ensure the content you produce is always unique.

Animated Infographics, Popularly Known as Gifographics

Gifographic

Who doesn’t like GIFs? We see them, smile at them and share them. The perfect mix for anything to go viral – use that in your infographic and you’re good to go! Happiness aside, animated infographics are gradually becoming the best infographics owing to the unlimited creative scope they offer. We humans are hardwired to retain visual information, something that static infographics can achieve. However, if you add a little motion to the entire scenario, you get an infographic that is far more visually appealing than its static counterpart. This ensures that chances of retention go higher. 

Animated infographics are types of infographics that use animation to bring life to your static infographics. If you’re just starting out, you should pick the best static infographics that you have and recycle them with animation. You would, however, need a good infographics designer for this task. Recycling old infographics with animation makes your best content even more appealing and shareable. 

Animation also grabs user attention more quickly than static infographics. Anything that moves on the screen is bound to get a second’s worth of attention, and if your infographic stands out in that instant, it has the potential of going viral. A drawback that comes with animated infographics is that they can only be small, owing to the limitations of GIF creations. However, you can overcome this drawback by breaking down your one big infographic into smaller chunks, which to be honest are a lot better for social sharing!

Interactive Infographics

As the name suggests, interactive infographics are well, interactive. They allow users to manipulate and interact with infographics by asking users to select answers or icons to present information. The great thing about interactive infographics is that they truly engage with your audience, and not just capture their attention. With interactive infographics, you can have multiple storylines leading to different end results. This type of infographic allows the audience to dig deeper without losing out on the bigger picture. 

The drawback with interactive infographics is that you would require a programmer to create a good interactive infographic. A lot of infographic design companies, including The Dreamer Designs, create interactive infographics as per user requirements. They can easily help you create infographics that users interact with and get answers based on their selections. However, if your main goal is to provide linear information, sticking to static or animated infographics is the better option.

Interactive infographics are more likely to be shared on social media. If your audience interacts with your infographic, you have achieved in one go, attention and retention. The higher the interaction, the more chances of users retaining humongous information and then sharing it. This helps the basic-goal of an infographic which is to provide information. Another important point to note here is that interactive infographics allow you to capture data. As users interact with your infographic, they provide you with a lot of insights related to the information on the infographic, you on the other hand, get valuable user data which you can use to further your business.

Video Infographics

Videos in their own form, work as great tools for retaining information. According to a study, if you gain information from a video, chances of retaining are higher even after 24 hours. That in itself makes videos a great marketing tool. Video infographics work on the same model. If you create a video infographic, you will be providing a massive chunk of information to your users within a minute. This will allow users to retain more on the subject than with say a traditional static infographic. 

Videos are great in bringing forth an emotional connect if presented correctly. Building on the same approach,  video infographics allow users to easily connect with the 

information on the screen. If the video infographic is about a great cause, users will easily click on the share button. This tells us that video infographics are great tools for conveying information to large audiences. 

The drawback of the type of infographic that is in video format is that you will require a designer familiar with creating video infographics. Another drawback of video infographics is that they can be quite heavy, so uploading may also be quite a task. However, videos are becoming very popular on social media platforms, so going the video way is not a bad idea after all.

HTML based Infographics Or Web-based Infographics

There’s always Google to think about! If you want Google to crawl your infographic, it can’t be created in the traditional JPEG format. If it is, Google will mark your infographic as an image and be done with it. However, infographics definition is that they provide information, so shouldn’t this information be crawled and help with your SEO efforts? Well, it should! But for that, you will have to let go of JPEG infographics and move on to the latest HTML based infographics.

 HTML based or web-based infographics are becoming increasingly popular owing to their capacity of taking on challenges like responsiveness and SEO. Infographics created via code, keep intact the information provided on the infographic as text. This text is then easily crawled and indexed by search engines like Google, Bing, Yahoo and more.

HTML Infographic for Mercedes Benz

If you use a lot of keywords in your infographic, you will be able to use it to enhance your SEO efforts. All the information that you have worked hard on creating is easily searchable on Google, allowing a lot of users to land on your website. 

The only drawback with HTML based infographics is that they can’t be shared on social media. However, to counteract that, you can create a JPEG of your HTML infographic and add a link which leads directly to your website. HTML based infographics come with a lot less limitation than its static and animated counterparts. They can be all the types of infographics combined into one. 

Another great thing about HTML or web-based infographics is that they are mobile responsive. So even if you create a huge/long infographic, it will appear on your smartphone, exactly like it does on desktop. No zooming required whatsoever! HTML based infographics are types of infographics that are becoming the leaders in the infographics world as they combine animation and interaction to provide information. What’s more, an animated infographic created via HTML doesn’t have any size restrictions!

Conclusions

Now that you’re aware of the types of infographics there are, it’s time to select the best infographic type for your business. If you want to provide linear information, go with a unique but static infographic. If however, you want your static information to capture more attention, your best bet is an animated infographic. Wondering about how to provide massive chunks of information? Go the video infographic way. If you need users to answer questions or to interact with your audience and want to capture data, go with interactive infographics. Coming down to the last one, if you want all the best features of all the infographics, stick to or start with HTML based infographics. These infographics pick the best qualities of all types of infographics and present them in an interactive format, they are searchable by Google and are mobile responsive. 

So don’t wait! Pick the infographic that works best with your business at the moment and go with it. You can create infographics using tools available online, however, those can be quite common. To get a unique infographic that is video, interactive or HTML based, you can easily get in touch with us, The Dreamer Designs. With a great team of designers, researchers, and content creators, we have been leading the space of infographics and have designed over 1200 infographics for brands like Mercedes, Nokia, Microsoft, CupoNation and more. We can help you create compelling infographics and are always up for a chat! 

HTML Infographic for Mercedes Benz

8 Things that You Must Not Miss when Hiring an Infographics Designer

By Animated Infographic, Crowdfunding Infographic, Html Infographic, Infographic, Interactive Infographic, Static Infographic, Video Based Infographic
8 Things that You Must Not Miss when Hiring an Infographics Designer

The infographic design space has been part of a major evolution and is one of the most time-tested ways of delivering your message to various audiences. Infographics mainly comprise of visual clues to communicate the intended message while ensuring that it stays relevant to the topic.

But before you join hands with the Infographics revolution and get added to the list of people being benefited by the extreme communicative power of this tool, it is essential that you hunt for the right infographic designer for your business. Listed below are a few but crucial things to look out for when hiring an infographics designer:

  1. Purchased Images

The designer should use licensed vectors and images in order to avoid copyright issues which can cost you tons. Most designers use images from so-called “free” websites like Freepik and use an image like the one in the below example. However, the detail that they miss is that attribution is required for using this image. This can lead to serious trouble if your infographic goes viral. Which exactly is the purpose behind designing it!  

Same is the case for fonts where infographic designers use fonts from sites like Dafont which provide some fonts for free but for personal-use-only license. It should be ensured that the designer is willing to share the licenses for all fonts, vectors and images used while ensuring that all assets used are good for commercial purposes. You really don’t want your infographic to be a matter of worry and legal issues when you have already displayed it on your platform for the world to see!

  1. Variety of Styles in Portfolio (flat style, process-based, data-based)

Infographics can be designed for a variety of purposes. You can ask an infographics designer to create an infographics resume , to illustrate a process , or to simply provide information about a product  or a service . Infographics can also be used to list down the top 5 – 10 USPs or so of a particular product or to compare two similar things visually.

Infographics can not only be created for a variety of purposes but also in a variety of different styles. To give you an idea, Flat Style Infographics  provide good quantity of content at a low price making them perfect for when you want to only provide information. Image based infographics. on the other hand are good for product based infographics and for more professional industries like the medical, finance etc.

Although there is no fixed-style for an infographic, the designer should know what style will help bring in higher conversions. Infographics that resonate with the target audience tend to bring in higher conversions, something that your infographics designer should be well aware of. Along with that, the design should complement well with the overall style of the brand or product that he/she will be representing via infographics.

  1. Ability to Level-Up Infographics When Needed (animated, interactive, responsive infographics)

Did you even know there is more than jpeg images when it comes to infographics?  Your designer created an infographic, shared it with you in a jpeg format, you posted it on social media and mostly received a positive response. However, you also got feedback that the infographic could have been more interesting but alas, you don’t know what to do with this excellent piece of information. Worry not!

There are several options that can be used to level-up your infographic and these options should be your designer’s first go-to. You can reuse the infographic with animation  and make it mobile-friendly. Yes, there are ways in which you can make your infographics mobile responsive and SEO-friendly ! If in case you have a content-heavy infographic, you can repurpose it for social media by converting it into social cards . Your designer should be able to help you scale-up and extract maximum out of your infographic.

  1. Infographics Created are Mobile Responsive & SEO-friendly

Check with your designer if the infographic created is mobile responsive and SEO-friendly to save yourself a lot of trouble. With mobile-first being the trend in the industry, you must ask your designer if they can convert infographics into a mobile responsive design via HTML so Google crawlers can read through the text. This will also allow your infographics to help you in your SEO efforts. You can use this infographic as an example  and request the designer to check the created infographic on both mobile and desktop.

  1. Beware of Template Based Designs

You must ensure that designers don’t create infographics for you using ready-made templates as that will kill the purpose of creating the infographic in the first place. The real purpose of an infographic is to present information in a unique and customized manner so that it tells your story. The designer should not fit your story in a ready-made template.

With a variety of drag-and-drop infographic builders in the market, designers can take this path. The problem with this is that owing to limited resources and tools, infographics created via drag-and-drop builders are never unique. Most of the infographics end up looking exactly similar and you probably don’t want your infographic to look like it was inspired from your competitors.

  1. Integration with Existing Systems (HTML, WordPress, Unbounce)

Before you go ahead with a designer, you must consider whether or not the infographic created is good enough to be part of your website or marketing plan? Can it be sent as a landing page using Unbounce or can it be part of your WordPress website ? You must consider if your infographic falls in line with your marketing efforts and if it be integrated with your existing brand guidelines?

  1. Experience with Infographics & Success Stories

How can your designer guarantee that the infographics they create are liked by your target audience? Truth is, they can do no such thing, however, they can provide you with proof of past success which can back up their claim. For example, infographic resume for Ben Fisher is an infographic that has been featured at various places across the web and is liked by many. You can also ask designers for their work experience, portfolio and the names of the brands they have worked with in the past.

The number of infographics worked on is also a good decisive factor when selecting an infographic designer. A designer with more than 1000 infographics designed can be considered to be a safe choice.

  1. Cost

You may wonder if an infographic designer will charge more if they have worked for big brands in the past. In order to get an idea, we will provide you with an industry cost of a basic infographic so you can negotiate better. For example, a static infographic for approx. 700×3000 px like this one should cost you around USD 200-300 depending upon the volume and timeline. The price will however increase with additional features like animation, mobile responsiveness, SEO-friendly design etc.. However, now that you have a fair idea regarding the cost, you can begin your search and negotiation from there.
Now that you know the points to consider when hiring an infographics designer, you must be ready to go ahead! However, if this seems like too much information you can always hire professional teams to take care of your infographics and other design requirements. When investing your time, effort and money, you must consider whether or not it is all worthwhile. Hiring professional ensures that the work you get is unique and tells your story in the best manner possible. If you want to hire great designers, you can get in touch with The Dreamer Designs , a company that understands all these things in detail and has years of experience in the infographics industry. Chances are that they already have infographics relevant to your business needs.

Ways in Which Landing Pages Can Drive Your Business

By Infographic

Landing pages have been around for a very long time and chances are that you’ve already heard a bit about what they do. To begin with, a landing page is different from a website, it’s a specifically designed page to increase sales, capture leads, or push a product out there into the world. 

If you’re not getting conversions via landing pages, chances are, you’re doing something wrong. This article will cover a few important points with proof to show you how a landing page can help a business like yours. Read on to understand how you can use landing pages to drive your business further. 

Landing pages are created with a specific purpose in mind. The purpose could range from capturing the contact information of visitors, building a large following, promoting a product or showcasing a sale offer. With a purpose defined, you can start focusing on other aspects of your landing page, ranging from the CTA to the design, all of which play a role in driving conversions.

As a business owner, you would want to get conversions at some point of time. Creating a landing page at that time is important. Listed below are various situations where launching a specific landing page for a special purpose can drive your business further and faster than the competition.

Businesses with segments & variations in the product

If you are in a business where you sell similar products with slight variations, a landing page can help you in targeted marketing. You can create landing pages for both variations and promote both pages in front of two segments of users. For example in a car sales business you can have focussed landing page for a particular car and another landing page for its variant. That will help you target only those looking for that car on your website and increase the chances of sales.

Beneficial for: Automobiles, electronics, design & software development, machinery & equipment, accessories & clothes, sports equipment etc

Industries where speed matters

Don’t send your users looking for products – they might get lost exploring your website. Instead, push the product via a particular landing page. This will allow users to quickly find and read about the specific offering without having to look for it themselves. This also increases your chances of providing information to your users very quickly and efficiently. 

Beneficial for: Medical professionals, lawyers, bail bond agents, dealing in products with a price below USD 10, event tickets, travel tickets etc.

If your product is quite technical

If you have a product or service with technical specifications, a landing page that provides technical specifications and detailed descriptions makes sense. With a landing page, you can describe in detail technical aspect which otherwise may not be possible on a homepage or inner page of  your website.

See how Creek Side Villas created a landing page to display all of their services, and how they generated great leads using the same page.

Beneficial for: Crypto, mobile devices, automobiles, technical services, Hosting & cloud services, machentronics, energy sectors, SEO etc.

Businesses with high competition

If you’re selling a product in a highly competitive market then creating a landing page to drive sales is a MUST. This will help you in capturing the attention of users looking for a product like yours – without you having to redirect them from your website’s homepage to another page on your website. They’ll directly ‘land’ on your landing page and find what they were looking for. The key is to deliver precise and quick information. If you can do that the chances of converting a sale is quite likely.

Beneficial for: Grocery, FMCG, household equipment, stationery, clothing, food, education, real estate, legal services, medical services, etc.

Creating a landing page is an important aspect for every business as it can help drive any business further. The idea is to find the purpose for creating a landing page and then using it to accomplish that purpose. It’s not difficult and can help you stay ahead of the competition.

Infographics – how this term is changing the way we consume content

By Infographic

The way we consume content has been dramatically changing in the last few years. With the widespread use of the internet and the use of smartphones at a global scale has made content easily accessible. Anyone with a smartphone and an internet connection can consume as well as publish content. Owing to this, there is more content available on the internet than ever before.

However, content posted online is becoming less receptive, every single day. With average attention span shrinking from 12 seconds in the year 2000, to 8 seconds at present, ensuring that your content is even acknowledged, becomes a tough task. Since 2016, there has been a drastic increase in the amount of content being posted online, making it easily accessible to anyone at any time of day or night. This allows people to skimp through articles, photographs, podcasts, videos, etc. With decreasing attention spans, people only spend time on content that they can grasp quickly and easily. Lengthy articles showing multiple statistics and graphs are out of the competition. Unless, they’re very good and by a piece of luck, stand out.

In such a scenario, it’s especially difficult for digital marketers and businesses to come up with innovative ideas to grab the attention of users. With content being posted every second, being innovative every single time, is also a tough task. According to an article published in Time Magazine, 55% of users that visit a page, spend only an average of 15 seconds skimming through the content. In such a scenario, coming up with ideas to maximize content utility and providing all answers in 15 seconds, is imminent. This is where infographics come in place.


Infographics provide a visual representation of your content while including important data points in their body. As visual beings, we only need to skim through an infographic while gaining all the information it’s trying to provide. Thus, utilizing infographics to present information is becoming the norm in the changing landscape of content consumption. Using infographics, any business or marketer can promote products or provide content to an audience, without worrying about getting lost in the chaos of content production.Well crafted infographicstend to make content easy to understand as well as memorable.


If you were to scroll through your online feed on any platform, you would see that the way people or brands communicate, is becoming increasingly visual. Pictures have been ‘saying a thousand words’ for a very long time now and short videos are becoming the norm. In such a scenario, we can easily acknowledge that the state in which we all communicate has moved towards visual representations, take Virtual Reality for example. Currently, most marketers rely on visuals when posting anything on social media – since visuals get more reception. According to new research, over 60% of marketers have used infographics to promote their business and to increase sales. Increasing number of mobile-friendly infographics have started changing the way in which we consume content on our smartphones as well – a thing that was earlier lacking for infographics.

Infographics work because 90% of the information that the brain receives via an infographic is in the form of visual content, this makes retention a lot easier. It’s true that we tend to forget what they read faster as compared to when we see. In fact, it has been noted that when we see visual content, we trigger various emotions that help us retain more information. Visual representations also help in connecting with the business or the brand promoting the infographic. If the content shown via any infographic is true and helpful, a user is likely to return to your website for more information. With infographics, you can build a loyal customer base, thereby ensuring that your content is always consumed by your returning audience.

In fact, you can push your website further ahead with the help of HTML based mobile-friendly infographics. These infographics are responsive on mobile and help you in your SEO efforts. Made with HTML 5, these infographics are crawlable, so any text you place on your infographic can be read by Google, thereby helping your SEO efforts and pushing your content further ahead. This will also give you an edge against the competition using basic infographics to push content further.

If you wish for your content to reach your audience, you will have to compete with this rapid pace of technology. In such a world, relying on old marketing techniques will do you more harm than good. If you were to publish an article about your product, people would probably skimp through the text and might just remember the brand name, if not the name of the product. With infographics, however, you can visually represent the specs of your product while ensuring that the customer would get impressed by the data collected on said product. If the product is good and that information is publicized properly, sales will inevitably increase.

What’s important here is to create innovative infographics that help you tell that story, without getting lost in the endless amount of content present online. When a well-created infographic gets posted online, marketing it further also becomes an easy task. Once that happens, you and your business can easily take off.


So grab the attention of your user by designing infographics that can convert. There are a few online websites which you can sign up on to create great infographics. If however, you want a professionally ideated infographic, which is backed by content strategy, you can get in touch with us. With a great team of designers, researchers, and content creators, we have been leading the space of infographics and have designed over 1200 infographics for brands like Mercedes, Nokia, Microsoft, AAP, Upwork and more. The infographics that we create are made with HTML with selectable text that Google can crawl, thereby helping you in your SEO efforts, they are also stunning, animated and interactive. Created with HTML 5 and with WordPress compatibility and mobile-friendly responsive design, we can help you push forward your products or content to online audiences.

How to get your business trending by following a method adopted by brands like Microsoft, Mercedes, and Cuponation?

By Infographic, Static Infographic

Do you want your business to trend?

Well, who doesn’t? But do you really think it’s possible? If you’re doubtful or don’t have an answer to that question then you’re at the right place. Reading this article will give you answers and convert your doubts into all assuming fact-based ‘Absolutely YES!’ sort of replies.


Now, the next question is HOW do you do that? 

The simplest answer is in the fact that to trend you need to align with something that’s already trending and ride the wave. 

So what’s trending since ages and not going to stop for years to come? Well, it’s a not-so-secret tool that you can use to trend your business. 


Cave Drawings/ Infographics/ Memes

Yes, it’s the visual form of presenting data that has always been there and is there to stay. 

Read on to find out the reason behind the success of cave drawings and how this Stone Age technique still rocks in the modern world.

How Infographics (the modern Cave Drawings) can be used for your business? 

Infographics are a medium of visual presentation of ideas. And there are some advantages infographics have as against textual information.

The most obvious advantage is that the images convey where there is a language barrier. Everyone understands represents money even if they do not understand the word ‘dinero’ (meaning ‘money’ in Spanish).

The other advantage is what we can understand by driving on a road. Ever wondered why sign boards on the road have symbols and not just text? That is because our brain perceives images faster than text.

The modern advantage of using infographic and also the advantage which will help you to trend is the gift of Social Media. We’ve all witnessed the speed at which we get messages or the speed at which anything goes viral – from memes to infographics to people. Travelling around the world is also becoming easier, ensuring large scale globalization. Ride in this wave with mini-infographics that are easy to share. You can also get a big infographic designed which can be broken into parts for social sharing.

SEO. And when I say SEO I really mean direct SEO and not indirect SEO. Yes, now you can have Google crawl through the text presented on your infographics. Created with code and offering a stunning design, infographics can now be used to increase SEO directly. To know more about how infographics can boost SEO

Trying your first one is easy

Now that you know why infographics are such a valuable resource to your business, it is time to get experimenting! Try creating & launching your first infographic. If you need professional help, we’re right here. And guess what you can have the same designers working for you who have worked for brands like Microsoft, Cuponation, Mercedes and that too at a budget starting at USD 200. To maximize your chances to get trending you can also opt for our Social Media Infographic Bundle which will also provide you with 3 to 4 posts for the same infographic specially for social sharing. So think wisely and evaluate if you wish to try this out and start trending or would prefer to keep wondering how others trend so very easily!

Go with experienced infographic designers for your first Infographic Design

 Just to set the expectations right, one infographic may not make you trend (Although there are high chances that it can) but it will be the start of a journey which will eventually result in more sales, more traffic, and more conversions, if done correctly. To do it right, contact the specialists at The Dreamer Designs who have an experience of designing over 1500 infographics.

Don’t wait. Get trending, today!