All Posts By

Nishant Sapra

Infographics – how this term is changing the way we consume content

By Infographic

The way we consume content has been dramatically changing in the last few years. With the widespread use of the internet and the use of smartphones at a global scale has made content easily accessible. Anyone with a smartphone and an internet connection can consume as well as publish content. Owing to this, there is more content available on the internet than ever before.

However, content posted online is becoming less receptive, every single day. With average attention span shrinking from 12 seconds in the year 2000, to 8 seconds at present, ensuring that your content is even acknowledged, becomes a tough task. Since 2016, there has been a drastic increase in the amount of content being posted online, making it easily accessible to anyone at any time of day or night. This allows people to skimp through articles, photographs, podcasts, videos, etc. With decreasing attention spans, people only spend time on content that they can grasp quickly and easily. Lengthy articles showing multiple statistics and graphs are out of the competition. Unless, they’re very good and by a piece of luck, stand out.

In such a scenario, it’s especially difficult for digital marketers and businesses to come up with innovative ideas to grab the attention of users. With content being posted every second, being innovative every single time, is also a tough task. According to an article published in Time Magazine, 55% of users that visit a page, spend only an average of 15 seconds skimming through the content. In such a scenario, coming up with ideas to maximize content utility and providing all answers in 15 seconds, is imminent. This is where infographics come in place.


Infographics provide a visual representation of your content while including important data points in their body. As visual beings, we only need to skim through an infographic while gaining all the information it’s trying to provide. Thus, utilizing infographics to present information is becoming the norm in the changing landscape of content consumption. Using infographics, any business or marketer can promote products or provide content to an audience, without worrying about getting lost in the chaos of content production.Well crafted infographicstend to make content easy to understand as well as memorable.


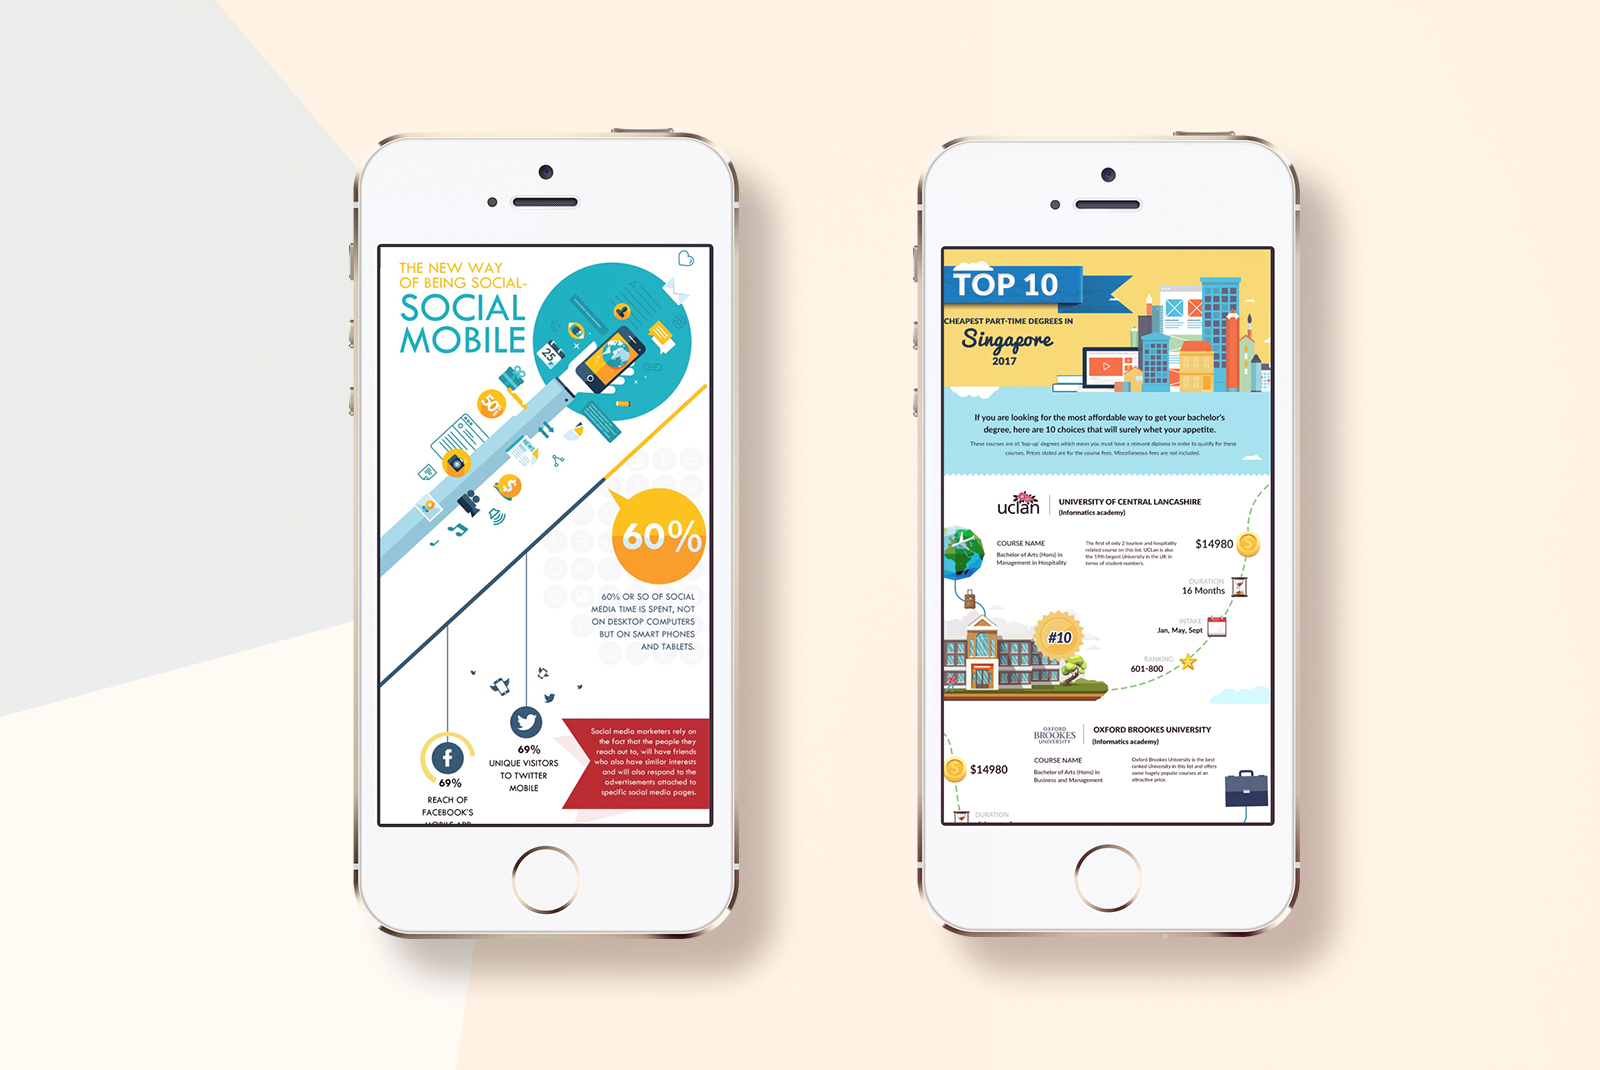
If you were to scroll through your online feed on any platform, you would see that the way people or brands communicate, is becoming increasingly visual. Pictures have been ‘saying a thousand words’ for a very long time now and short videos are becoming the norm. In such a scenario, we can easily acknowledge that the state in which we all communicate has moved towards visual representations, take Virtual Reality for example. Currently, most marketers rely on visuals when posting anything on social media – since visuals get more reception. According to new research, over 60% of marketers have used infographics to promote their business and to increase sales. Increasing number of mobile-friendly infographics have started changing the way in which we consume content on our smartphones as well – a thing that was earlier lacking for infographics.

Infographics work because 90% of the information that the brain receives via an infographic is in the form of visual content, this makes retention a lot easier. It’s true that we tend to forget what they read faster as compared to when we see. In fact, it has been noted that when we see visual content, we trigger various emotions that help us retain more information. Visual representations also help in connecting with the business or the brand promoting the infographic. If the content shown via any infographic is true and helpful, a user is likely to return to your website for more information. With infographics, you can build a loyal customer base, thereby ensuring that your content is always consumed by your returning audience.

In fact, you can push your website further ahead with the help of HTML based mobile-friendly infographics. These infographics are responsive on mobile and help you in your SEO efforts. Made with HTML 5, these infographics are crawlable, so any text you place on your infographic can be read by Google, thereby helping your SEO efforts and pushing your content further ahead. This will also give you an edge against the competition using basic infographics to push content further.

If you wish for your content to reach your audience, you will have to compete with this rapid pace of technology. In such a world, relying on old marketing techniques will do you more harm than good. If you were to publish an article about your product, people would probably skimp through the text and might just remember the brand name, if not the name of the product. With infographics, however, you can visually represent the specs of your product while ensuring that the customer would get impressed by the data collected on said product. If the product is good and that information is publicized properly, sales will inevitably increase.

What’s important here is to create innovative infographics that help you tell that story, without getting lost in the endless amount of content present online. When a well-created infographic gets posted online, marketing it further also becomes an easy task. Once that happens, you and your business can easily take off.


So grab the attention of your user by designing infographics that can convert. There are a few online websites which you can sign up on to create great infographics. If however, you want a professionally ideated infographic, which is backed by content strategy, you can get in touch with us. With a great team of designers, researchers, and content creators, we have been leading the space of infographics and have designed over 1200 infographics for brands like Mercedes, Nokia, Microsoft, AAP, Upwork and more. The infographics that we create are made with HTML with selectable text that Google can crawl, thereby helping you in your SEO efforts, they are also stunning, animated and interactive. Created with HTML 5 and with WordPress compatibility and mobile-friendly responsive design, we can help you push forward your products or content to online audiences.

How to get your business trending by following a method adopted by brands like Microsoft, Mercedes, and Cuponation?

By Infographic, Static Infographic

Do you want your business to trend?

Well, who doesn’t? But do you really think it’s possible? If you’re doubtful or don’t have an answer to that question then you’re at the right place. Reading this article will give you answers and convert your doubts into all assuming fact-based ‘Absolutely YES!’ sort of replies.


Now, the next question is HOW do you do that? 

The simplest answer is in the fact that to trend you need to align with something that’s already trending and ride the wave. 

So what’s trending since ages and not going to stop for years to come? Well, it’s a not-so-secret tool that you can use to trend your business. 


Cave Drawings/ Infographics/ Memes

Yes, it’s the visual form of presenting data that has always been there and is there to stay. 

Read on to find out the reason behind the success of cave drawings and how this Stone Age technique still rocks in the modern world.

How Infographics (the modern Cave Drawings) can be used for your business? 

Infographics are a medium of visual presentation of ideas. And there are some advantages infographics have as against textual information.

The most obvious advantage is that the images convey where there is a language barrier. Everyone understands represents money even if they do not understand the word ‘dinero’ (meaning ‘money’ in Spanish).

The other advantage is what we can understand by driving on a road. Ever wondered why sign boards on the road have symbols and not just text? That is because our brain perceives images faster than text.

The modern advantage of using infographic and also the advantage which will help you to trend is the gift of Social Media. We’ve all witnessed the speed at which we get messages or the speed at which anything goes viral – from memes to infographics to people. Travelling around the world is also becoming easier, ensuring large scale globalization. Ride in this wave with mini-infographics that are easy to share. You can also get a big infographic designed which can be broken into parts for social sharing.

SEO. And when I say SEO I really mean direct SEO and not indirect SEO. Yes, now you can have Google crawl through the text presented on your infographics. Created with code and offering a stunning design, infographics can now be used to increase SEO directly. To know more about how infographics can boost SEO

Trying your first one is easy

Now that you know why infographics are such a valuable resource to your business, it is time to get experimenting! Try creating & launching your first infographic. If you need professional help, we’re right here. And guess what you can have the same designers working for you who have worked for brands like Microsoft, Cuponation, Mercedes and that too at a budget starting at USD 200. To maximize your chances to get trending you can also opt for our Social Media Infographic Bundle which will also provide you with 3 to 4 posts for the same infographic specially for social sharing. So think wisely and evaluate if you wish to try this out and start trending or would prefer to keep wondering how others trend so very easily!

Go with experienced infographic designers for your first Infographic Design

 Just to set the expectations right, one infographic may not make you trend (Although there are high chances that it can) but it will be the start of a journey which will eventually result in more sales, more traffic, and more conversions, if done correctly. To do it right, contact the specialists at The Dreamer Designs who have an experience of designing over 1500 infographics.

Don’t wait. Get trending, today!

Wondering how to retain user attention? Go the infographics way.

By Infographic

With incredible amounts of information being added to the internet every second, capturing and retaining the attention of a user is a daunting task. Information overload is becoming a real problem with people moving away from countless words and incomprehensible sheets towards content that is easy to grasp and retain.

For information that can’t fit onto videos and podcasts, one would still require a way to relay information to the consumer. Enter infographics, a powerful tool that can take up incomprehensible data and turns it into visually appealing content which is easy to digest.

Infographics meaning is very clear, it uses an artistic way to collate and present information without losing the user’s interest. Infographics use multiple variations in colour, design, negative space, tables, charts, graphs, maps etc. to convert words into fun, attention-grabbing and engaging content. No doubt that infographics are changing the way we consume content.

Infographics have been generating a lot of attention owing to the fact that they visually represent extensive research material in a crisp and credible manner. Owing to this factor, infographics are becoming quite popular among organizations operating online as well as offline. Infographics sift through data, pick important points and show them to consumers so they can make decisions quickly and effectively.

Mentioned below are 8 reasons why infographics are impactful and the various ways in which they can benefit your business:

1. ATTENTION-GRABBING: If you’ve ever come across an infographic, you would know how attractive they can be. They provide information in a crisp manner capturing the interest of the user. With images, graphs, and visually appealing content, they ensure that a user will pause before moving forward. Bright colours, maps, and various design elements, also ensure that infographics don’t blend into each other, tickling our natural instinct which makes us such visual creatures

2. MAKE DATA COMPREHENSIBLE: Infographics are known for sifting through hoards of data, selecting essential data points, statistics, and figures and representing them in an attractive and relatively small area. With infographics, you wouldn’t be sending out a lot of content to grab user attention but creative chunks that solve the same purpose, but with higher CTRs

3. ANSWER QUESTIONS: Creative infographic ideas can find a way to answer user questions in an attractive manner. They can help bring in effective changes for which the infographic is being used

4. SUPPORT DECISION MAKING: In today’s fast-paced world, getting reliable information quickly can help save time and decrease decision-making time. This can be beneficial for businesses as they can get information that can easily be interpreted and lead to decisions that are accurate and quick

5. BUILDS TRUST: Infographics use graphs, charts, tables, arrows, and various other such elements to present information. The use of such elements takes forward important information to the users and helps them make correct decisions based on your expertise. This process gains the trust of each individual user and ensures user attention.

6. BRANDING: Infographics that are correct and visually appealing help users in gaining information that they require. If your infographics provide that information, you gain the user’s trust. This helps your business brand itself into the minds of the users as experts in the field

7. BUILD SOCIAL PRESENCE: Owing to the amount of information present on infographics, they can be used as social media posts to attract the attention of users and build an online presence. Infographics that share information have the potential of going viral thereby generating free branding and new user acquisition. To do this, you should always ensure that your infographics have your logo, name, and relevant contact details

8. INCREASE GOOGLE RANKING: Posting your content on websites and social media can generate a lot of back-link that can help increase SEO. Another way of increasing SEO is by creating SEO-friendly infographics – a new type of infographics created by us, The Dreamer Designs. The infographics that we create are made with HTML 5 with selectable text that Google can crawl. This advent in the creation of infographics helps generate a lot of SEO traffic. Read more about HTML based infographics here.

Infographics are a great way of generating business, relaying information and accelerating decision-making processes. These reasons have made infographics very popular in all industries, online as well as offline.

To create an effective infographic, you must keep the following points in mind:

1. ORIGINAL: A creative and original infographic has the potential of going viral and infinitely increasing your audience base. Original content also has the ability to be more attractive and attention-grabbing

2. EASY TO UNDERSTAND: If your infographic is not simple to understand, it may lose the quality that makes it so very attractive. Simple content ensures that people don’t get lost trying to understand the infographic, instead, they spend that time trying to understand and retain the information that the infographic is designed to provide

3. RELEVANT: The infographic that you create should be contextually relevant and concise. It should not talk about multiple variables that are not linked, this should be done to retain the attention of the user and not lose that attention due to factors that could have easily been avoided

4. SHOULD HAVE A UNIVERSAL DESIGN: You should ensure that the design of your infographic is universal so that basic signs and elements used can be understood by everyone. Using elements that may have different meanings may cause problems in relaying the correct information to all people

Infographics are a great way of providing information, retaining user attention, and driving business. If you intend on creating Infographics you must ensure that they are accessible to all people and show relevant content. There are many online infographic maker websites and infographic creators that you can connect with if you have any infographic creation requirements. The Dreamer Designs is one such infographics website. With a great team of designers, researchers, and content creators, we have been leading the space of infographics and have designed over 1200 infographics for brands like Mercedes, Cuponation, Microsoft, and more. If you’re looking for someone who can help you in generating infographic ideas, creating beautiful infographics, or want to have your questions answered, please click here.

Being a winner will be BIG

By Announcements, Design
It’s so gripping to have touched this milestone and becoming a part of the ury is enthralling.
AWWWARDS are a pipe dream triumph for any designer and being a part of the jury means a great deal.

If you are not sure, you can get a review by experts at The Dreamer Designs.

Get your website audit done for FREE by a member of Young Jury at AWWWARDS

Yes! I want free web audit

With this young Jury certificate comes the message which states ” a group of leading digital design professionals who use their experience and knowledge to judge web projects from all over the world” and I have a hunch that our long haul has paid off and has started yielding fruits of a big hit.
It’s furthermore a long way and we have our seatbelts tight!

But that’s not it!

Go ahead and get a no obligation, absolutely free 20 minutes one-o-one discussion with our experts and get your answers.

Ways you can reach us

We are all ears if you wish to get in touch. Here are several ways you can get in touch with us. We are waiting to hear from you

Secret Sauce Recipe for Art of Designing Infographics

By Innovation

After designing more than 1000 infographics and counting we have found a secret sauce recipe for making an infographic awesome and effective. I will try my best to make this article best suited for experienced infographic designers and beginners alike.

Let’s know what the term means. Info graphics is basically the easiest way to understand and communicate. The presentation of information in form of graphics, images, and designs is known to be Info graphics. Info graphics not only deals with mere information in written form but it presents the data in such a way that it gets easy for the layman to understand and grasp the knowledge.

Now let’s know how a standard Info graphics work:

Header-

The main part of the Info graphic is a header in which the title is written. The focus of the person working on Info graphics should be that, the title is bold, stylish and should be attractive and have a little text supporting the title. The title is the foremost part of Info graphics and should be written and designed with utmost care. Here’s an example below of how a title with text should be written.

Body-

Then comes the body or the content part of the graphics which gives the main information and data. It is very important to keep in mind that the text in the body part should be limited to the main data. The text should only have 15-20 words.

The data in percentage, digits and important facts can be written in bold font or in a way that they get highlighted. The percentages and similar data need not be limited to traditional graph styles like pie diagram and charts but can creative direction based on topic.

Here’s an example of how the facts in digits and percentage are written in bold fonts or you can also show the information in an unique way just like it is shown in the image below. Showing 25% of the branches of the tree empty.

The body of the graphic can also have segregating elements related to the topic which can further give information related to the topic. The segments should be designed in such a way that it relates to the topic and yet look attractive to the reader/client.

For example in the image above the text in the graphic for “beautiful beaches”, the segment is divided by waves because it relates to beaches.

Here is another example below which clear your doubts of how important it is to give relatable segments to the graphic.

Footer-

TLast bit of a static Info graphic is footer which can have links to information sources and branding of client. The sources part is generally less prominent than overall graphic. In the picture below you’ll see the example of footer. The black section in bottom section which contains the sources, name of the company all comes in the footer part.

These were some of the main steps and key points to be kept in mind while working on a static Info graphic. Apart from this there are various types of graphics like GIF-ographics.

GIF-ographic is a level higher than Info graphics which makes the graphics look more professional and yet eye-catching. It is more like an animation with graphics and designs and facts. A GIF-ographic is SEO friendly and attracts more audience.

Info graphics can also be designed in a way that they adapt to responsive environment and they are generally called as web-based Info graphics. Web based IFG are made using HTML.

It’s not over yet, Info graphics also helps you to create a new resume. Long gone the days when CVs used to be boring. Info graphics adds so much that makes your resume appealing at first glance itself.

Below is an example of a resume made with the help of Info graphics. You can more attractive resumes using Info graphics.

In a world of bigdata and facts where every detail is important and valuable, Info graphics, is the new trend in world of graphic designing.